• 文献检索
  • 文档翻译
  • 深度研究
  • 学术资讯
  • Suppr Zotero 插件Zotero 插件
  • 邀请有礼
  • 套餐&价格
  • 历史记录
应用&插件
Suppr Zotero 插件Zotero 插件浏览器插件Mac 客户端Windows 客户端微信小程序
定价
高级版会员购买积分包购买API积分包
服务
文献检索文档翻译深度研究API 文档MCP 服务
关于我们
关于 Suppr公司介绍联系我们用户协议隐私条款
关注我们

Suppr 超能文献

核心技术专利:CN118964589B侵权必究
粤ICP备2023148730 号-1Suppr @ 2026

文献检索

告别复杂PubMed语法,用中文像聊天一样搜索,搜遍4000万医学文献。AI智能推荐,让科研检索更轻松。

立即免费搜索

文件翻译

保留排版,准确专业,支持PDF/Word/PPT等文件格式,支持 12+语言互译。

免费翻译文档

深度研究

AI帮你快速写综述,25分钟生成高质量综述,智能提取关键信息,辅助科研写作。

立即免费体验

坎贝尔-罗布森图表上可见的曲线并非对比敏感度函数。

The Curve Visible on the Campbell-Robson Chart Is Not the Contrast Sensitivity Function.

作者信息

Tardif Jessica, Watson Marcus R, Giaschi Deborah, Gosselin Frédéric

机构信息

Département de Psychologie, Université de Montréal, Montréal, QC, Canada.

Department of Biology, York University, Toronto, ON, Canada.

出版信息

Front Neurosci. 2021 Mar 9;15:626466. doi: 10.3389/fnins.2021.626466. eCollection 2021.

DOI:10.3389/fnins.2021.626466
PMID:33767608
原文链接:https://pmc.ncbi.nlm.nih.gov/articles/PMC7985182/
Abstract

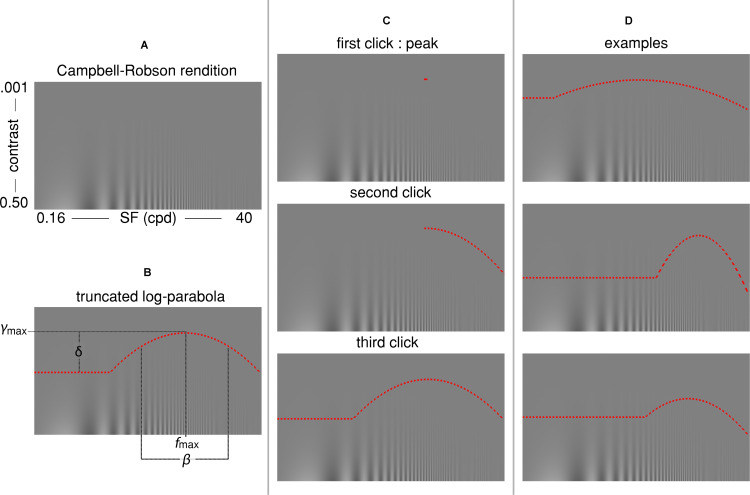
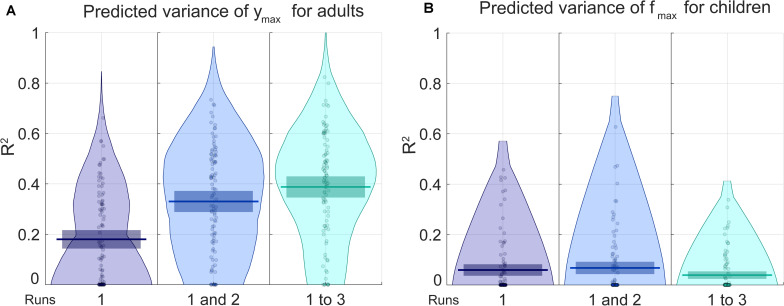
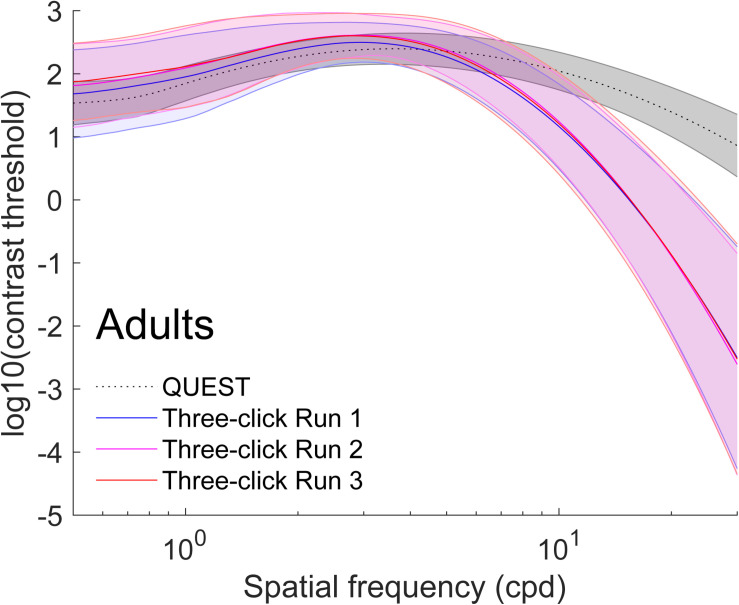
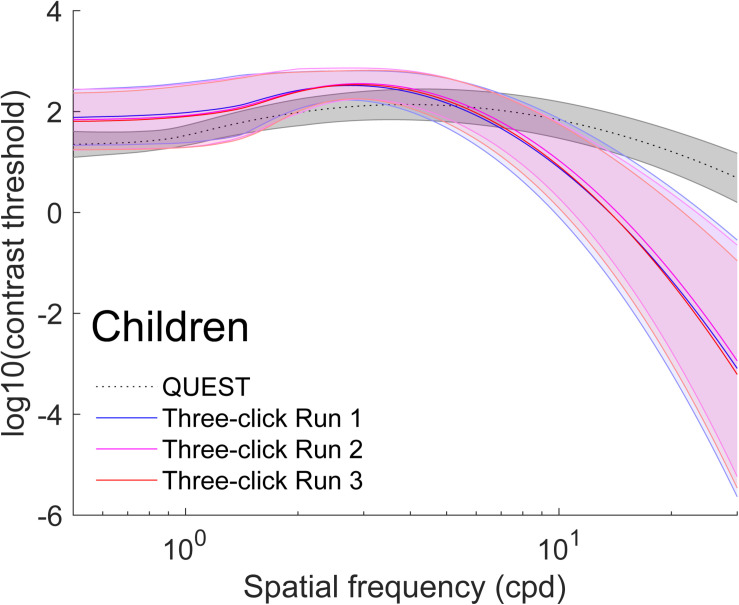
The Campbell-Robson chart is a highly popular figure used in psychophysics and visual perception textbooks to illustrate the Contrast Sensitivity Function (CSF). The chart depicts a grating which varies logarithmically in spatial frequency (SF) from left to right and in contrast from bottom to top. Campbell and Robson's (1964) intuition was that the boundary between the grating and the homogeneous gray area (below threshold) would trace the shape of the observer's own CSF. In this paper, we tested this intuition. A total of 170 participants (96 adults and 74 children) adjusted the four parameters of a truncated log-parabola directly onto a Campbell-Robson chart rendition and completed a gold-standard CSF evaluation. We hoped that this procedure which requires a mere three clicks on the computer mouse, would speed up the measurement of the CSF to under a minute. Unfortunately, the only parameter of the truncated log-parabola fitted to the gold-standard CSF data that could be predicted from the Campbell-Robson chart data was the peak sensitivity for the adult participants. We conclude that the curve visible on the Campbell-Robson chart cannot be used practically to measure the CSF.

摘要

坎贝尔 - 罗布森图表是心理物理学和视觉感知教科书中广泛使用的一种图形,用于说明对比敏感度函数(CSF)。该图表描绘了一个光栅,其空间频率(SF)从左到右呈对数变化,对比度从下到上变化。坎贝尔和罗布森(1964年)的直觉是,光栅与均匀灰色区域(低于阈值)之间的边界将描绘出观察者自身CSF的形状。在本文中,我们对这一直觉进行了测试。共有170名参与者(96名成年人和74名儿童)直接在坎贝尔 - 罗布森图表的版本上调整截断对数抛物线的四个参数,并完成了一项金标准CSF评估。我们希望这个只需在电脑鼠标上点击三次的程序,能将CSF的测量速度加快到一分钟以内。不幸的是,从坎贝尔 - 罗布森图表数据中能够预测到的、与金标准CSF数据拟合的截断对数抛物线的唯一参数,是成年参与者的峰值敏感度。我们得出结论,坎贝尔 - 罗布森图表上可见的曲线实际上不能用于测量CSF。

https://cdn.ncbi.nlm.nih.gov/pmc/blobs/6a74/7985182/d8c2c290fe88/fnins-15-626466-g005.jpg
https://cdn.ncbi.nlm.nih.gov/pmc/blobs/6a74/7985182/3914dff80d80/fnins-15-626466-g001.jpg
https://cdn.ncbi.nlm.nih.gov/pmc/blobs/6a74/7985182/476b8d0e724a/fnins-15-626466-g002.jpg
https://cdn.ncbi.nlm.nih.gov/pmc/blobs/6a74/7985182/8d1360fe84fb/fnins-15-626466-g003.jpg
https://cdn.ncbi.nlm.nih.gov/pmc/blobs/6a74/7985182/4247f993da4c/fnins-15-626466-g004.jpg
https://cdn.ncbi.nlm.nih.gov/pmc/blobs/6a74/7985182/d8c2c290fe88/fnins-15-626466-g005.jpg

相似文献

1
The Curve Visible on the Campbell-Robson Chart Is Not the Contrast Sensitivity Function.坎贝尔-罗布森图表上可见的曲线并非对比敏感度函数。
Front Neurosci. 2021 Mar 9;15:626466. doi: 10.3389/fnins.2021.626466. eCollection 2021.
2
Clinical assessment of two new contrast sensitivity charts.两种新型对比敏感度图表的临床评估
Br J Ophthalmol. 2007 Jun;91(6):749-52. doi: 10.1136/bjo.2006.109280. Epub 2006 Dec 13.
3
Contrast Sensitivity对比敏感度
4
Predicting individual contrast sensitivity functions from acuity and letter contrast sensitivity measurements.根据视力和字母对比度敏感度测量结果预测个体对比度敏感度函数。
J Vis. 2016 Dec 1;16(15):15. doi: 10.1167/16.15.15.
5
An evaluation of the Mars Letter Contrast Sensitivity Test.火星信件对比敏感度测试的评估。
Optom Vis Sci. 2005 Nov;82(11):970-5. doi: 10.1097/01.opx.0000187844.27025.ea.
6
Effects of spherical and astigmatic defocus on acuity and contrast sensitivity: a comparison of three clinical charts.
Optom Vis Sci. 1991 Jun;68(6):418-26. doi: 10.1097/00006324-199106000-00003.
7
Differences in the legibility of letters at contrast threshold using the Pelli-Robson chart.使用佩利-罗布森视力表时,对比度阈值下字母清晰度的差异。
Ophthalmic Physiol Opt. 1990 Oct;10(4):323-6. doi: 10.1111/j.1475-1313.1990.tb00877.x.
8
Assessment of contrast sensitivity by Spaeth Richman Contrast Sensitivity Test and Pelli Robson Chart Test in patients with varying severity of glaucoma.应用 Spaeth Richman 对比敏感度试验和 Pelli Robson 图表试验评估不同严重程度青光眼患者的对比敏感度。
Eye (Lond). 2018 Aug;32(8):1392-1400. doi: 10.1038/s41433-018-0099-y. Epub 2018 May 14.
9
[Assessment of mesopic and contrast vision for driving licences: which cut-off values, which methods are appropriate?].[驾驶执照的中间视觉和对比度视觉评估:哪些临界值,哪些方法合适?]
Klin Monbl Augenheilkd. 2013 Nov;230(11):1106-13. doi: 10.1055/s-0033-1351030. Epub 2013 Nov 4.
10
Three clinical tests of the spatial contrast sensitivity function: a comparison.
Am J Optom Physiol Opt. 1986 Jun;63(6):413-8. doi: 10.1097/00006324-198606000-00004.

引用本文的文献

1
Assessment of visual function using mobile Apps.使用移动应用程序评估视觉功能。
Eye (Lond). 2024 Aug;38(12):2406-2414. doi: 10.1038/s41433-024-03031-2. Epub 2024 Mar 20.

本文引用的文献

1
Perceptual learning improves contrast sensitivity, visual acuity, and foveal crowding in amblyopia.知觉学习可改善弱视患者的对比敏感度、视敏度和中央凹拥挤现象。
Restor Neurol Neurosci. 2017;35(5):483-496. doi: 10.3233/RNN-170731.
2
A Normative Data Set for the Clinical Assessment of Achromatic and Chromatic Contrast Sensitivity Using a qCSF Approach.使用qCSF方法进行消色差和色差对比敏感度临床评估的规范数据集。
Invest Ophthalmol Vis Sci. 2017 Jul 1;58(9):3628-3636. doi: 10.1167/iovs.17-21645.
3
Evaluation of the precision of contrast sensitivity function assessment on a tablet device.
评估平板电脑设备上的对比敏感度函数评估的精度。
Sci Rep. 2017 Apr 21;7:46706. doi: 10.1038/srep46706.
4
Rapid and reliable assessment of the contrast sensitivity function on an iPad.在 iPad 上快速可靠地评估对比敏感度功能。
Invest Ophthalmol Vis Sci. 2013 Nov 5;54(12):7266-73. doi: 10.1167/iovs.13-11743.
5
Measuring contrast sensitivity.测量对比敏感度。
Vision Res. 2013 Sep 20;90:10-4. doi: 10.1016/j.visres.2013.04.015. Epub 2013 May 3.
6
Effect of cataract type and severity on visual acuity and contrast sensitivity.白内障类型和严重程度对视力及对比敏感度的影响。
J Ophthalmic Vis Res. 2011 Jan;6(1):26-31.
7
Bayesian adaptive estimation of the contrast sensitivity function: the quick CSF method.对比敏感度函数的贝叶斯自适应估计:快速CSF方法
J Vis. 2010 Mar 30;10(3):17.1-21. doi: 10.1167/10.3.17.
8
The noisy-bit method for digital displays: converting a 256 luminance resolution into a continuous resolution.数字显示器的噪声位方法:将256级亮度分辨率转换为连续分辨率。
Behav Res Methods. 2008 Aug;40(3):735-43. doi: 10.3758/brm.40.3.735.
9
The Freiburg Visual Acuity Test-variability unchanged by post-hoc re-analysis.弗莱堡视力测试——事后重新分析未改变变异性
Graefes Arch Clin Exp Ophthalmol. 2007 Jul;245(7):965-71. doi: 10.1007/s00417-006-0474-4. Epub 2007 Jan 12.
10
Treated amblyopes remain deficient in spatial vision: a contrast sensitivity and external noise study.接受治疗的弱视患者在空间视觉方面仍存在缺陷:一项对比敏感度和外部噪声研究。
Vision Res. 2007 Jan;47(1):22-34. doi: 10.1016/j.visres.2006.09.015. Epub 2006 Nov 13.