• 文献检索
  • 文档翻译
  • 深度研究
  • 学术资讯
  • Suppr Zotero 插件Zotero 插件
  • 邀请有礼
  • 套餐&价格
  • 历史记录
应用&插件
Suppr Zotero 插件Zotero 插件浏览器插件Mac 客户端Windows 客户端微信小程序
定价
高级版会员购买积分包购买API积分包
服务
文献检索文档翻译深度研究API 文档MCP 服务
关于我们
关于 Suppr公司介绍联系我们用户协议隐私条款
关注我们

Suppr 超能文献

核心技术专利:CN118964589B侵权必究
粤ICP备2023148730 号-1Suppr @ 2026

文献检索

告别复杂PubMed语法,用中文像聊天一样搜索,搜遍4000万医学文献。AI智能推荐,让科研检索更轻松。

立即免费搜索

文件翻译

保留排版,准确专业,支持PDF/Word/PPT等文件格式,支持 12+语言互译。

免费翻译文档

深度研究

AI帮你快速写综述,25分钟生成高质量综述,智能提取关键信息,辅助科研写作。

立即免费体验

基于地理加权机器学习模型的美国 2 型糖尿病(T2D)流行的空间异质性研究

Geographically weighted machine learning model for untangling spatial heterogeneity of type 2 diabetes mellitus (T2D) prevalence in the USA.

机构信息

University at Buffalo, State University at New York, Buffalo, USA.

Research and Education in Energy, Environment, and Water (RENEW) Institute, University at Buffalo, State University at New York, 108 Cooke Hall, Buffalo, NY, 14260, USA.

出版信息

Sci Rep. 2021 Mar 26;11(1):6955. doi: 10.1038/s41598-021-85381-5.

DOI:10.1038/s41598-021-85381-5
PMID:33772039
原文链接:https://pmc.ncbi.nlm.nih.gov/articles/PMC7997882/
Abstract

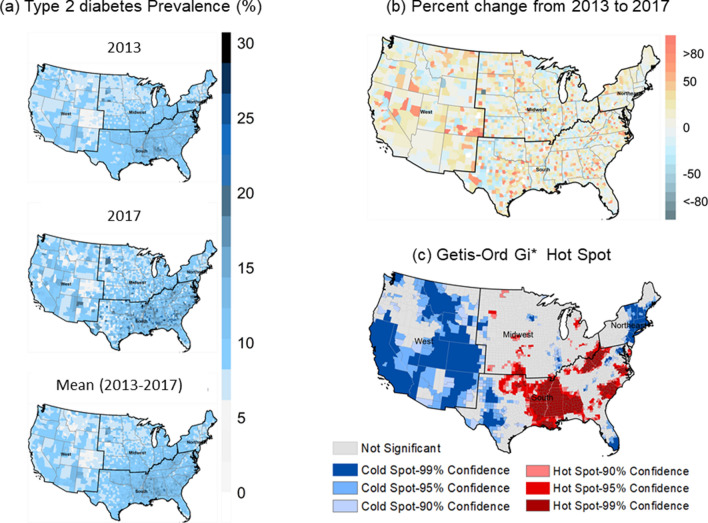
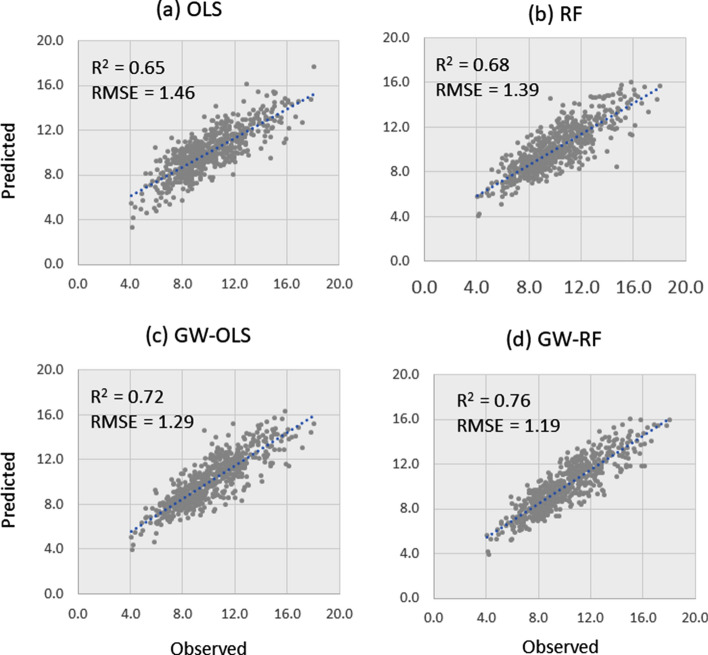
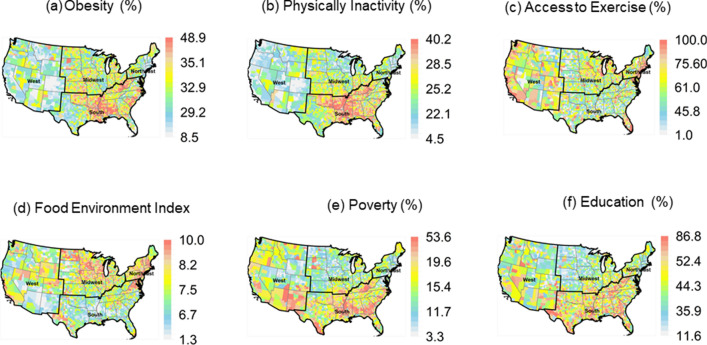
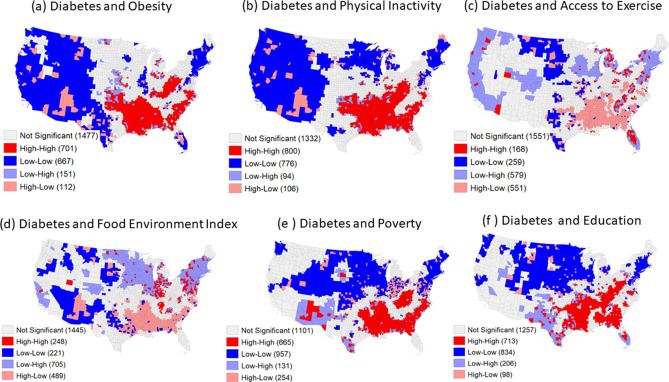
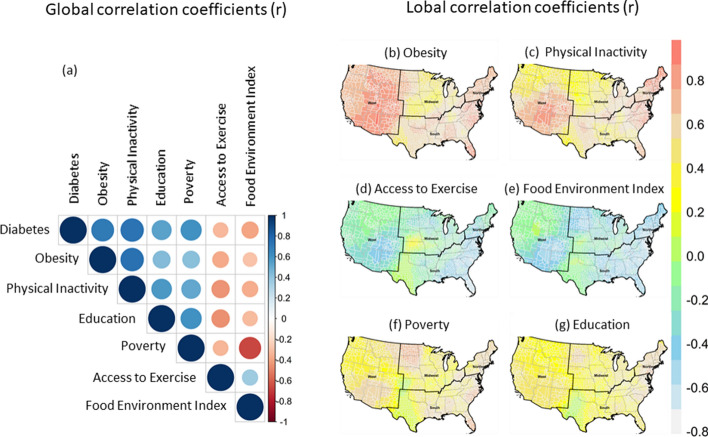
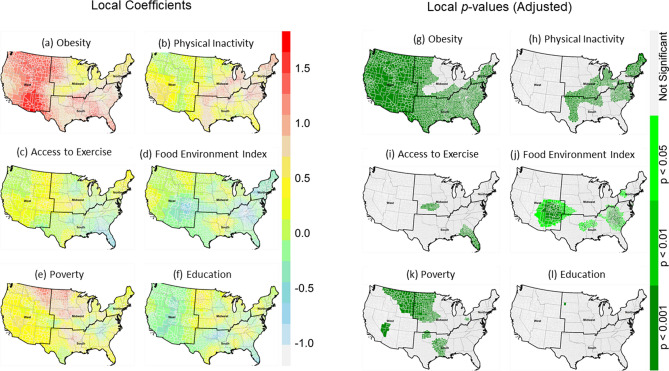
Type 2 diabetes mellitus (T2D) prevalence in the United States varies substantially across spatial and temporal scales, attributable to variations of socioeconomic and lifestyle risk factors. Understanding these variations in risk factors contributions to T2D would be of great benefit to intervention and treatment approaches to reduce or prevent T2D. Geographically-weighted random forest (GW-RF), a tree-based non-parametric machine learning model, may help explore and visualize the relationships between T2D and risk factors at the county-level. GW-RF outputs are compared to global (RF and OLS) and local (GW-OLS) models between the years of 2013-2017 using low education, poverty, obesity, physical inactivity, access to exercise, and food environment as inputs. Our results indicate that a non-parametric GW-RF model shows a high potential for explaining spatial heterogeneity of, and predicting, T2D prevalence over traditional local and global models when inputting six major risk factors. Some of these predictions, however, are marginal. These findings of spatial heterogeneity using GW-RF demonstrate the need to consider local factors in prevention approaches. Spatial analysis of T2D and associated risk factor prevalence offers useful information for targeting the geographic area for prevention and disease interventions.

摘要

2 型糖尿病(T2D)在美国的流行程度在空间和时间尺度上存在很大差异,这归因于社会经济和生活方式风险因素的变化。了解这些风险因素对 T2D 的贡献变化将极大地有益于干预和治疗方法,以减少或预防 T2D。基于树的非参数机器学习模型——地理加权随机森林(GW-RF),可以帮助探索和可视化县一级 T2D 与风险因素之间的关系。使用低教育水平、贫困、肥胖、身体活动不足、运动机会和食物环境作为输入,GW-RF 输出结果与 2013-2017 年期间的全局(RF 和 OLS)和局部(GW-OLS)模型进行了比较。我们的研究结果表明,在输入六个主要风险因素时,与传统的局部和全局模型相比,非参数 GW-RF 模型在解释 T2D 流行率的空间异质性和预测方面具有很高的潜力。然而,其中一些预测是边缘的。使用 GW-RF 进行的空间异质性研究结果表明,在预防方法中需要考虑局部因素。T2D 及相关风险因素流行率的空间分析为针对预防和疾病干预的地理区域提供了有用信息。

https://cdn.ncbi.nlm.nih.gov/pmc/blobs/84ba/7997882/996f0c16a215/41598_2021_85381_Fig7_HTML.jpg
https://cdn.ncbi.nlm.nih.gov/pmc/blobs/84ba/7997882/c176ff3f3d22/41598_2021_85381_Fig1_HTML.jpg
https://cdn.ncbi.nlm.nih.gov/pmc/blobs/84ba/7997882/206434a360de/41598_2021_85381_Fig2_HTML.jpg
https://cdn.ncbi.nlm.nih.gov/pmc/blobs/84ba/7997882/4ae3c6cc6046/41598_2021_85381_Fig3_HTML.jpg
https://cdn.ncbi.nlm.nih.gov/pmc/blobs/84ba/7997882/7630ed7c04e5/41598_2021_85381_Fig4_HTML.jpg
https://cdn.ncbi.nlm.nih.gov/pmc/blobs/84ba/7997882/2a8f1c556507/41598_2021_85381_Fig5_HTML.jpg
https://cdn.ncbi.nlm.nih.gov/pmc/blobs/84ba/7997882/f4db5c8d04fc/41598_2021_85381_Fig6_HTML.jpg
https://cdn.ncbi.nlm.nih.gov/pmc/blobs/84ba/7997882/996f0c16a215/41598_2021_85381_Fig7_HTML.jpg

相似文献

1
Geographically weighted machine learning model for untangling spatial heterogeneity of type 2 diabetes mellitus (T2D) prevalence in the USA.基于地理加权机器学习模型的美国 2 型糖尿病(T2D)流行的空间异质性研究
Sci Rep. 2021 Mar 26;11(1):6955. doi: 10.1038/s41598-021-85381-5.
2
Socioeconomic and environmental factors of poverty in China using geographically weighted random forest regression model.中国贫困的社会经济和环境因素:基于地理加权随机森林回归模型的研究。
Environ Sci Pollut Res Int. 2022 May;29(22):33205-33217. doi: 10.1007/s11356-021-17513-3. Epub 2022 Jan 13.
3
Geographically weighted machine learning for modeling spatial heterogeneity in traffic crash frequency and determinants in US.基于地统计学的机器学习方法在美国用于建模交通碰撞频率及其决定因素的空间异质性。
Accid Anal Prev. 2024 May;199:107528. doi: 10.1016/j.aap.2024.107528. Epub 2024 Mar 5.
4
Associations of lifestyle factors (smoking, alcohol consumption, diet and physical activity) with type 2 diabetes among American adults from National Health and Nutrition Examination Survey (NHANES) 2005-2014.生活方式因素(吸烟、饮酒、饮食和体力活动)与 2005-2014 年美国国家健康和营养调查(NHANES)中成年人 2 型糖尿病的关系。
J Diabetes. 2017 Sep;9(9):846-854. doi: 10.1111/1753-0407.12492. Epub 2016 Dec 1.
5
Determinants of adult sedentary behavior and physical inactivity for the primary prevention of diabetes in historically disadvantaged communities: A representative cross-sectional population-based study from Reunion Island.历史上处于不利地位社区中成年人久坐行为和身体活动不足的决定因素:来自留尼汪岛的具有代表性的横断面基于人群的研究。
PLoS One. 2024 Aug 13;19(8):e0308650. doi: 10.1371/journal.pone.0308650. eCollection 2024.
6
Predicting geographical variation in health-related quality of life.预测健康相关生活质量的地域差异。
Prev Med. 2019 Sep;126:105742. doi: 10.1016/j.ypmed.2019.05.030. Epub 2019 May 31.
7
Do the risk factors for type 2 diabetes mellitus vary by location? A spatial analysis of health insurance claims in Northeastern Germany using kernel density estimation and geographically weighted regression.2型糖尿病的风险因素是否因地区而异?使用核密度估计和地理加权回归对德国东北部医疗保险索赔进行的空间分析。
Int J Health Geogr. 2016 Nov 3;15(1):38. doi: 10.1186/s12942-016-0068-2.
8
Prevalence and risk factors of type 2 diabetes in older Vietnam-born Australians.老年越裔澳大利亚人 2 型糖尿病的患病率及危险因素。
J Community Health. 2014 Feb;39(1):99-107. doi: 10.1007/s10900-013-9745-2.
9
Physical inactivity displays a mediator role in the association of diabetes and poverty: A spatiotemporal analysis.身体活动不足在糖尿病与贫困的关联中起中介作用:一项时空分析。
Geospat Health. 2017 Nov 3;12(2):528. doi: 10.4081/gh.2017.528.
10
Explainable artificial intelligence (XAI) for exploring spatial variability of lung and bronchus cancer (LBC) mortality rates in the contiguous USA.可解释人工智能(XAI)用于探索美国相邻地区肺癌和支气管癌(LBC)死亡率的空间变异性。
Sci Rep. 2021 Dec 16;11(1):24090. doi: 10.1038/s41598-021-03198-8.

引用本文的文献

1
Spatial analysis of county-level determinants of overdose mortality in the United States using spatial machine learning.使用空间机器学习对美国县级药物过量死亡率的决定因素进行空间分析。
BMC Public Health. 2025 Jul 2;25(1):2230. doi: 10.1186/s12889-025-23375-y.
2
Alzheimer's Disease Dementia Prevalence in the United States: A County-Level Spatial Machine Learning Analysis.美国阿尔茨海默病性痴呆症的患病率:县级空间机器学习分析
Am J Alzheimers Dis Other Demen. 2025 Jan-Dec;40:15333175251335570. doi: 10.1177/15333175251335570. Epub 2025 Apr 21.
3
The generative revolution: AI foundation models in geospatial health-applications, challenges and future research.

本文引用的文献

1
Distribution of the environmental and socioeconomic risk factors on COVID-19 death rate across continental USA: a spatial nonlinear analysis.美国大陆各地 COVID-19 死亡率的环境和社会经济风险因素分布:空间非线性分析。
Environ Sci Pollut Res Int. 2021 Feb;28(6):6587-6599. doi: 10.1007/s11356-020-10962-2. Epub 2020 Oct 1.
2
Assessing county-level determinants of diabetes in the United States (2003-2012).评估美国 2003-2012 年县一级糖尿病决定因素。
Health Place. 2020 May;63:102324. doi: 10.1016/j.healthplace.2020.102324. Epub 2020 Mar 13.
3
A geographically weighted random forest approach for evaluate forest change drivers in the Northern Ecuadorian Amazon.
生成式革命:地理空间健康应用中的人工智能基础模型、挑战与未来研究
Int J Health Geogr. 2025 Apr 2;24(1):6. doi: 10.1186/s12942-025-00391-0.
4
Analysis of the Predictors of Mortality from Ischemic Heart Diseases in the Southern Region of Brazil: A Geographic Machine-Learning-Based Study.巴西南部地区缺血性心脏病死亡率预测因素分析:一项基于地理机器学习的研究。
Glob Heart. 2024 Nov 27;19(1):89. doi: 10.5334/gh.1371. eCollection 2024.
5
Food deserts exposure, density of fast-food restaurants, and park access: Exploring the association of food and recreation environments with obesity and diabetes using global and local regression models.食物荒漠暴露、快餐店密度和公园可达性:利用全球和局部回归模型探索食物和娱乐环境与肥胖和糖尿病的关系。
PLoS One. 2024 Apr 18;19(4):e0301121. doi: 10.1371/journal.pone.0301121. eCollection 2024.
6
Geographic variation and racial disparities in adoption of newer glucose-lowering drugs with cardiovascular benefits among US Medicare beneficiaries with type 2 diabetes.美国 Medicare 计划 2 型糖尿病受益人群中新型降糖药物(具有心血管获益)的采用存在地域差异和种族差异。
PLoS One. 2024 Jan 29;19(1):e0297208. doi: 10.1371/journal.pone.0297208. eCollection 2024.
7
An early warning model of type 2 diabetes risk based on POI visit history and food access management.基于 POI 访问记录和食物获取管理的 2 型糖尿病风险预警模型。
PLoS One. 2023 Jul 26;18(7):e0288231. doi: 10.1371/journal.pone.0288231. eCollection 2023.
8
Spatial patterns in sociodemographic factors explain to a large extent the prevalence of hypertension and diabetes in Aragon (Spain).社会人口学因素的空间模式在很大程度上解释了西班牙阿拉贡地区高血压和糖尿病的患病率。
Front Med (Lausanne). 2023 Jan 25;10:1016157. doi: 10.3389/fmed.2023.1016157. eCollection 2023.
9
Variation in and Factors Associated With US County-Level Cancer Mortality, 2008-2019.2008-2019 年美国县一级癌症死亡率的变化及相关因素。
JAMA Netw Open. 2022 Sep 1;5(9):e2230925. doi: 10.1001/jamanetworkopen.2022.30925.
10
Ranking the importance of demographic, socioeconomic, and underlying health factors on US COVID-19 deaths: A geographical random forest approach.基于地理随机森林的方法对美国 COVID-19 死亡病例的人口统计学、社会经济和潜在健康因素的重要性进行排名。
Health Place. 2022 Mar;74:102744. doi: 10.1016/j.healthplace.2022.102744. Epub 2022 Jan 31.
一种用于评估厄瓜多尔亚马逊北部森林变化驱动因素的地理加权随机森林方法。
PLoS One. 2019 Dec 23;14(12):e0226224. doi: 10.1371/journal.pone.0226224. eCollection 2019.
4
Predicting geographical variation in health-related quality of life.预测健康相关生活质量的地域差异。
Prev Med. 2019 Sep;126:105742. doi: 10.1016/j.ypmed.2019.05.030. Epub 2019 May 31.
5
Projection of the future diabetes burden in the United States through 2060.到2060年美国未来糖尿病负担的预测。
Popul Health Metr. 2018 Jun 15;16(1):9. doi: 10.1186/s12963-018-0166-4.
6
Food Insecurity, Food "Deserts," and Glycemic Control in Patients With Diabetes: A Longitudinal Analysis.食物不安全、食物“荒漠”与糖尿病患者的血糖控制:纵向分析。
Diabetes Care. 2018 Jun;41(6):1188-1195. doi: 10.2337/dc17-1981. Epub 2018 Mar 19.
7
Built environmental characteristics and diabetes: a systematic review and meta-analysis.建筑环境特征与糖尿病:系统评价与荟萃分析
BMC Med. 2018 Jan 31;16(1):12. doi: 10.1186/s12916-017-0997-z.
8
Characterization of the Spatial and Temporal Distribution of Nipah Virus Spillover Events in Bangladesh, 2007-2013.2007-2013 年孟加拉国尼帕病毒溢出事件的时空分布特征。
J Infect Dis. 2018 Apr 11;217(9):1390-1394. doi: 10.1093/infdis/jiy015.
9
County-level contextual factors associated with diabetes incidence in the United States.与美国糖尿病发病率相关的县级背景因素。
Ann Epidemiol. 2018 Jan;28(1):20-25.e2. doi: 10.1016/j.annepidem.2017.11.002. Epub 2017 Nov 23.
10
Examining the relationship between the food environment and adult diabetes prevalence by county economic and racial composition: an ecological study.按县经济和种族构成审视食物环境与成人糖尿病患病率之间的关系:一项生态学研究。
BMC Public Health. 2017 Aug 9;17(1):648. doi: 10.1186/s12889-017-4658-0.