Viterbi Faculty of Electrical Engineering, Technion - Israel Institute of Technology, Haifa, Israel.
Department of Pathology, School of Medicine, Yale University, New Haven, Connecticut, United States of America.
PLoS Comput Biol. 2021 Mar 29;17(3):e1008741. doi: 10.1371/journal.pcbi.1008741. eCollection 2021 Mar.
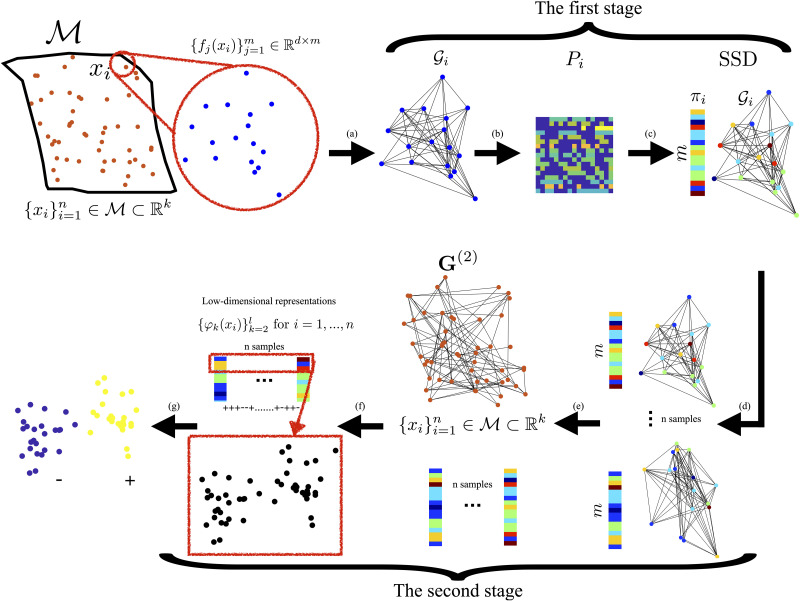
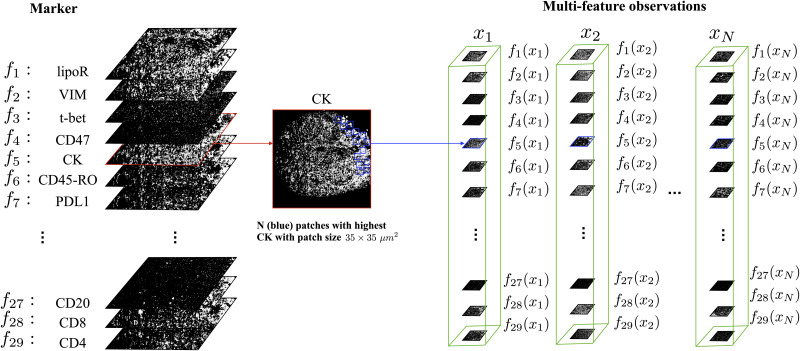
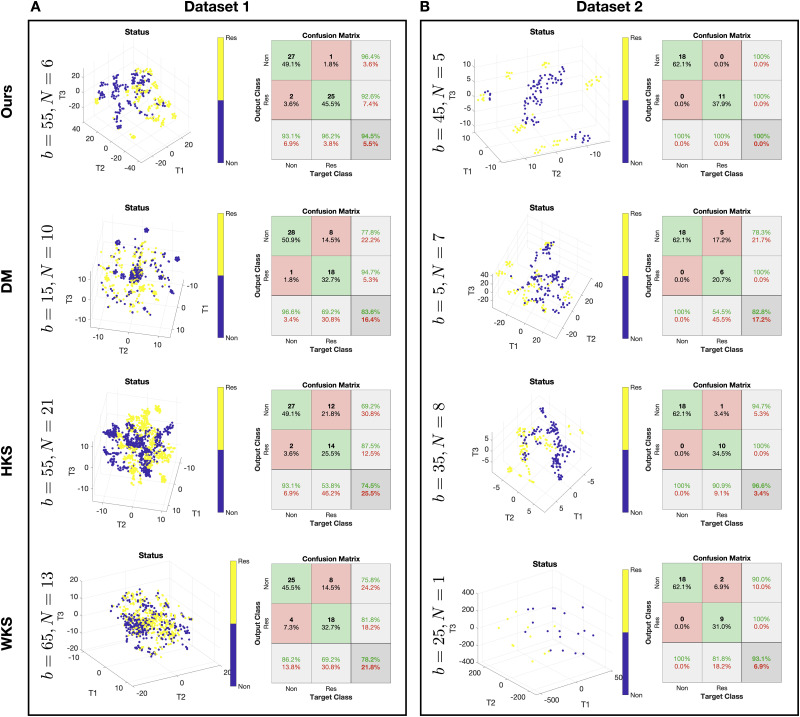
Imaging Mass Cytometry (IMC) combines laser ablation and mass spectrometry to quantitate metal-conjugated primary antibodies incubated in intact tumor tissue slides. This strategy allows spatially-resolved multiplexing of dozens of simultaneous protein targets with 1μm resolution. Each slide is a spatial assay consisting of high-dimensional multivariate observations (m-dimensional feature space) collected at different spatial positions and capturing data from a single biological sample or even representative spots from multiple samples when using tissue microarrays. Often, each of these spatial assays could be characterized by several regions of interest (ROIs). To extract meaningful information from the multi-dimensional observations recorded at different ROIs across different assays, we propose to analyze such datasets using a two-step graph-based approach. We first construct for each ROI a graph representing the interactions between the m covariates and compute an m dimensional vector characterizing the steady state distribution among features. We then use all these m-dimensional vectors to construct a graph between the ROIs from all assays. This second graph is subjected to a nonlinear dimension reduction analysis, retrieving the intrinsic geometric representation of the ROIs. Such a representation provides the foundation for efficient and accurate organization of the different ROIs that correlates with their phenotypes. Theoretically, we show that when the ROIs have a particular bi-modal distribution, the new representation gives rise to a better distinction between the two modalities compared to the maximum a posteriori (MAP) estimator. We applied our method to predict the sensitivity to PD-1 axis blockers treatment of lung cancer subjects based on IMC data, achieving 97.3% average accuracy on two IMC datasets. This serves as empirical evidence that the graph of graphs approach enables us to integrate multiple ROIs and the intra-relationships between the features at each ROI, giving rise to an informative representation that is strongly associated with the phenotypic state of the entire image.
成像质谱细胞术 (IMC) 将激光烧蚀和质谱结合在一起,定量分析在完整肿瘤组织切片中孵育的金属偶联的初级抗体。这种策略允许以 1μm 的分辨率对数十个同时的蛋白质靶标进行空间分辨的多重分析。每个载玻片都是一个空间分析,由不同空间位置收集的高维多元观察结果(m 维特征空间)组成,并从单个生物样本或甚至使用组织微阵列时从多个样本的代表性点捕获数据。通常,这些空间分析中的每一个都可以由几个感兴趣区域(ROI)来描述。为了从不同 ROI 在不同分析中记录的多维观察结果中提取有意义的信息,我们建议使用两步基于图的方法来分析这些数据集。我们首先为每个 ROI 构建一个表示 m 个协变量之间相互作用的图,并计算一个 m 维向量来表示特征之间的稳态分布。然后,我们使用所有这些 m 维向量来构建来自所有分析的 ROI 之间的图。这个第二张图受到非线性降维分析的影响,检索 ROI 的内在几何表示。这种表示为不同 ROI 的高效和准确组织提供了基础,与它们的表型相关。从理论上讲,我们表明,当 ROI 具有特定的双峰分布时,与最大后验(MAP)估计器相比,新表示导致两种模式之间的更好区分。我们将我们的方法应用于基于 IMC 数据预测肺癌患者对 PD-1 轴阻滞剂治疗的敏感性,在两个 IMC 数据集上实现了 97.3%的平均准确率。这是一个经验证据,表明图的图方法使我们能够整合多个 ROI 和每个 ROI 中特征之间的内在关系,从而产生与整个图像的表型状态强烈相关的信息表示。