Ye Yang, Qiu Hongfei
Department of Landscape Architecture, College of Horticulture and Forest, Huazhong Agricultural University, No. 1, Shizishan Street, Hongshan District, Wuhan, Hubei Province, 430070, China.
Key Laboratory of Urban Agriculture in Central China, Ministry of Agriculture and Rural Affairs, China.
Urban For Urban Green. 2021 Jul;62:127126. doi: 10.1016/j.ufug.2021.127126. Epub 2021 Apr 2.
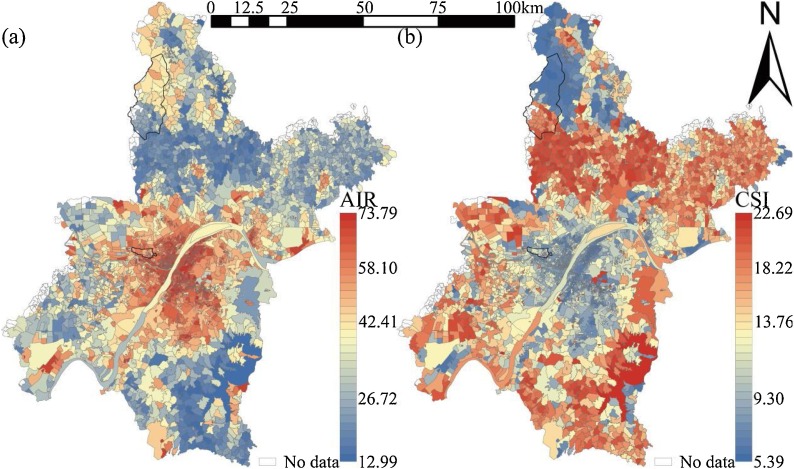
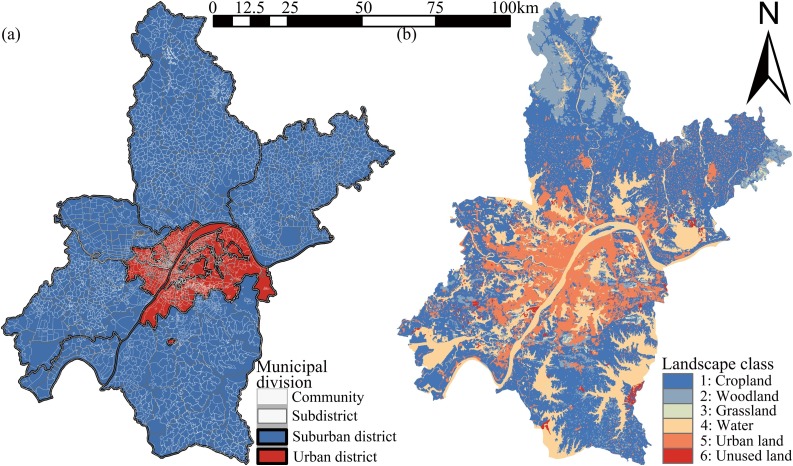
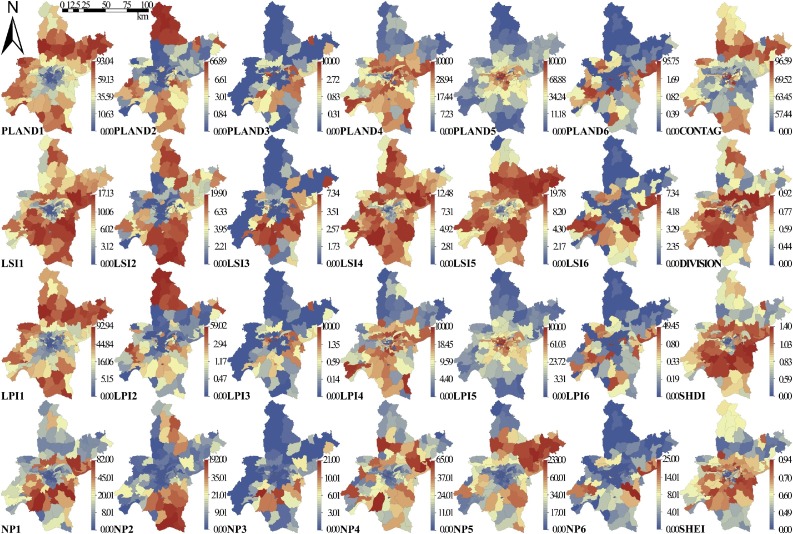
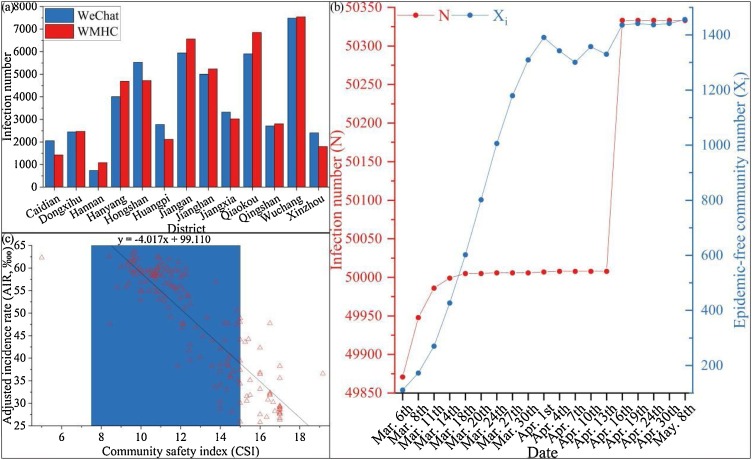
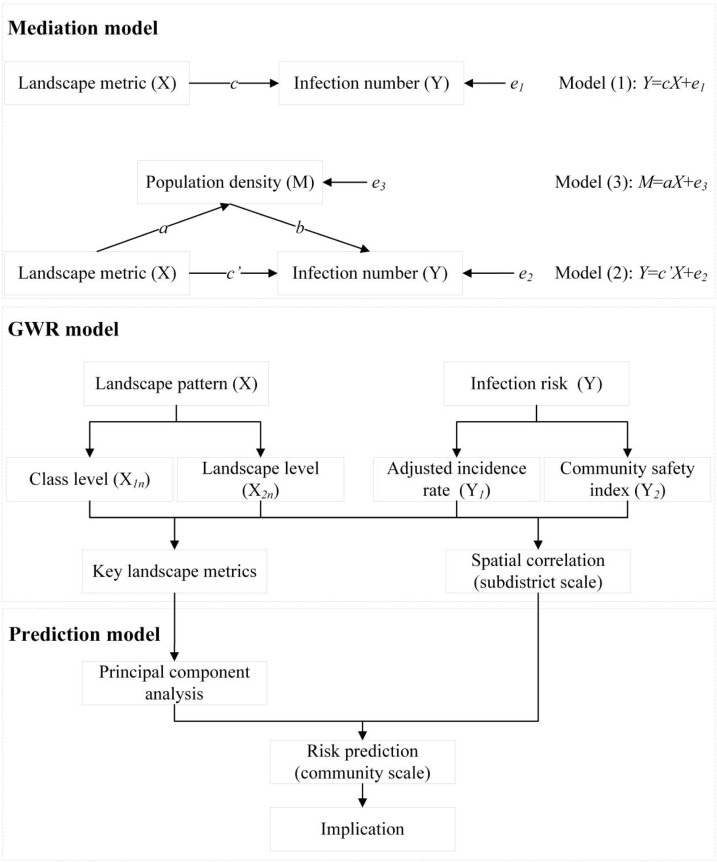
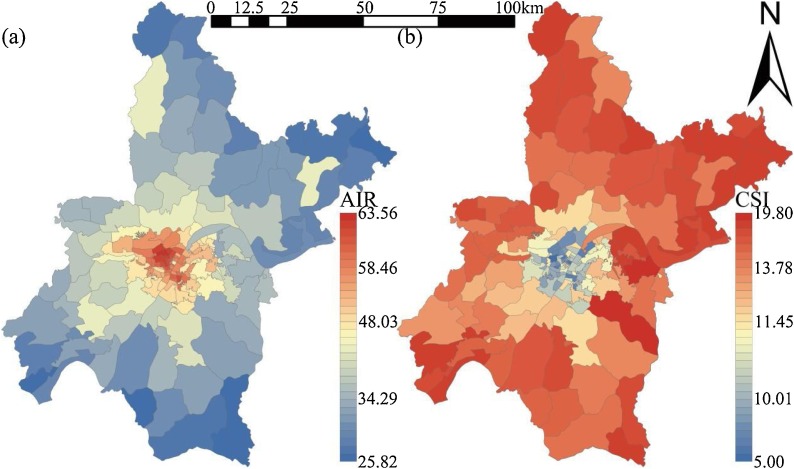
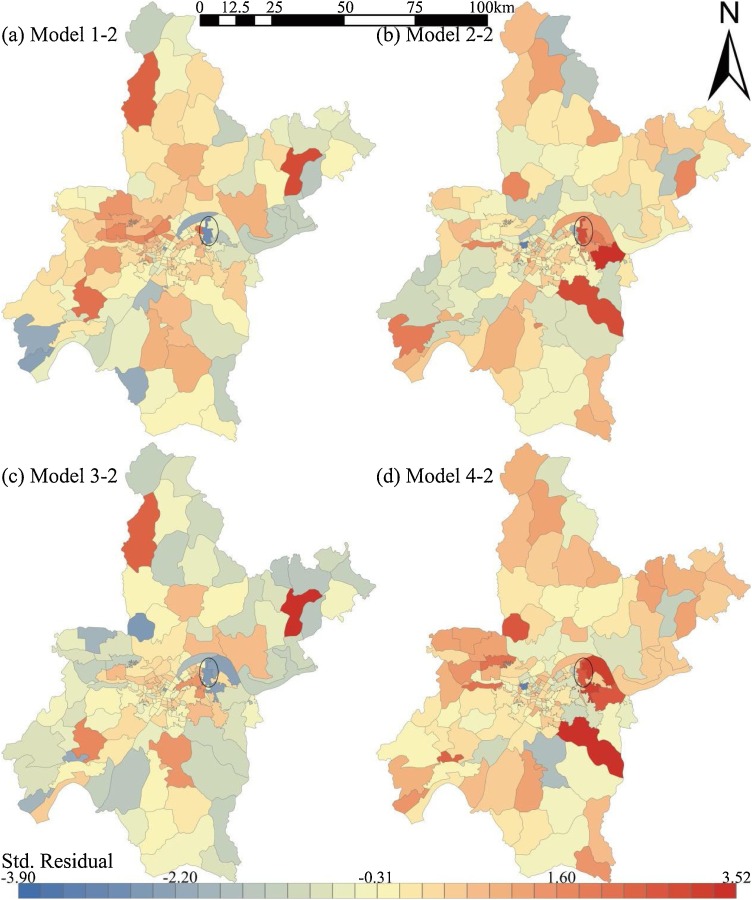
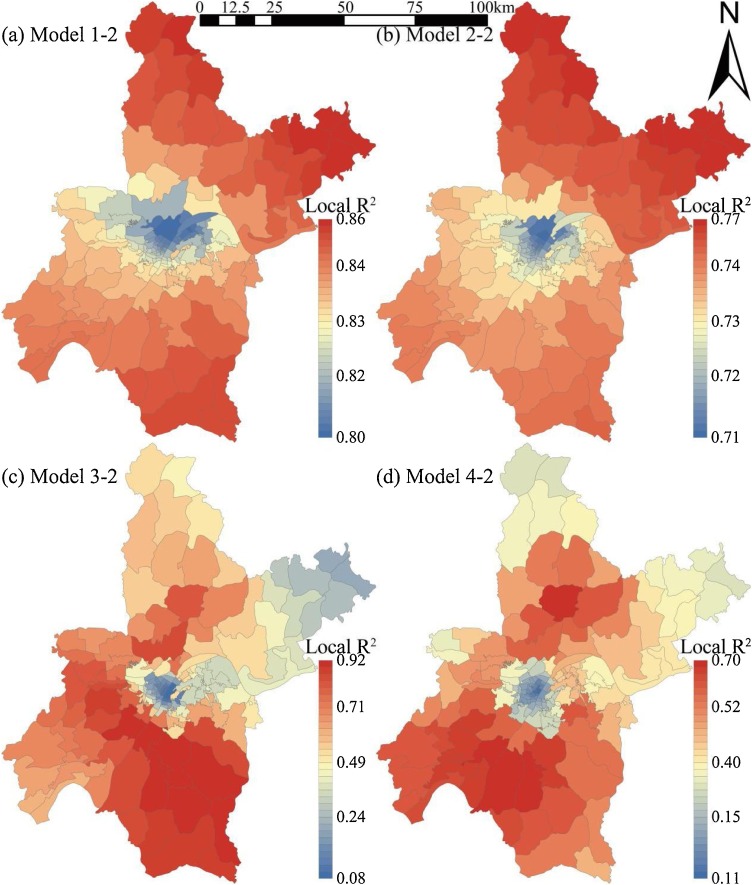
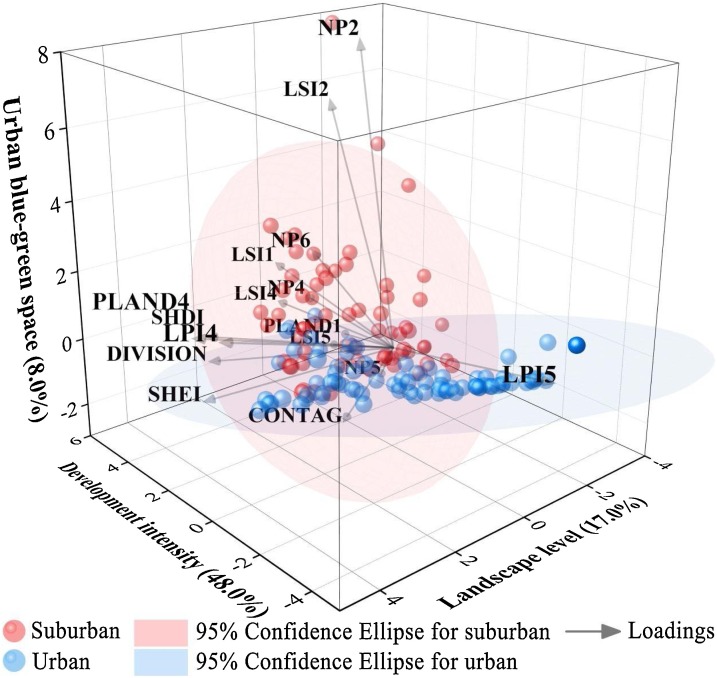
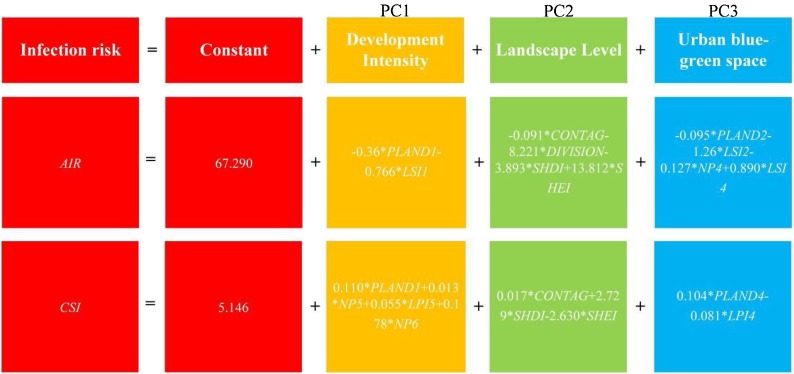
COVID-19 case numbers in 161 sub-districts of Wuhan were investigated based on landscape epidemiology, and their landscape metrics were calculated based on land use/land cover (LULC). Initially, a mediation model verified a partially mediated population role in the relationship between landscape pattern and infection number. Adjusted incidence rate (AIR) and community safety index (CSI), two indicators for infection risk in sub-districts, were 25.82∼63.56 ‱ and 3.00∼15.87 respectively, and central urban sub-districts were at higher infection risk. Geographically weighted regression (GWR) performed better than OLS regression with AICc differences of 7.951∼181.261. The adjusted R in GWR models of class-level index and infection risk were 0.697 to 0.817, while for the landscape-level index they were 0.668 to 0.835. Secondly, 16 key landscape metrics were identified based on GWR, and then a prediction model for infection risk in sub-districts and communities was developed. Using principal component analysis (PCA), development intensity, landscape level, and urban blue-green space were considered to be principal components affecting disease infection risk, explaining 73.1 % of the total variance. Cropland (PLAND and LSI), urban land (NP, LPI, and LSI) and unused land (NP) represent development intensity, greatly affecting infection risk in urban areas. Landscape level CONTAG, DIVISION, SHDI, and SHEI represent mobility and connectivity, having a profound impact on infection risk in both urban and suburban areas. Water (PLAND, NP, LPI, and LSI) and woodland (NP, and LSI) represent urban blue-green spaces, and were particularly important for infection risk in suburban areas. Based on urban landscape pattern, we proposed a framework to understand and evaluate infection risk. These findings provide a basis for risk evaluation and policy-making of urban infectious disease, which is significant for community management and urban planning for infectious disease worldwide.
基于景观流行病学调查了武汉市161个街道的新冠肺炎病例数,并根据土地利用/土地覆盖(LULC)计算其景观指标。最初,一个中介模型验证了人口在景观格局与感染数之间的关系中起到部分中介作用。街道感染风险的两个指标,即调整发病率(AIR)和社区安全指数(CSI),分别为25.82∼63.56‱和3.00∼15.87,中心城区街道的感染风险更高。地理加权回归(GWR)的表现优于普通最小二乘法回归,AICc差异为7.951∼181.261。类别水平指数与感染风险的GWR模型中调整后的R为0.697至0.817,而景观水平指数的调整后R为0.668至0.835。其次,基于GWR确定了16个关键景观指标,然后建立了街道和社区感染风险预测模型。使用主成分分析(PCA),发展强度、景观水平和城市蓝绿空间被认为是影响疾病感染风险的主要成分,解释了总方差的73.1%。农田(斑块面积百分比和景观形状指数)、城市用地(斑块数量、最大斑块指数和景观形状指数)和未利用土地(斑块数量)代表发展强度,对城市地区的感染风险有很大影响。景观水平的蔓延度指数、分割度、香农多样性指数和香农均匀度指数代表流动性和连通性,对城市和郊区的感染风险都有深远影响。水体(斑块面积百分比、斑块数量、最大斑块指数和景观形状指数)和林地(斑块数量和景观形状指数)代表城市蓝绿空间,对郊区的感染风险尤为重要。基于城市景观格局,我们提出了一个理解和评估感染风险的框架。这些发现为城市传染病的风险评估和决策提供了依据,对全球传染病的社区管理和城市规划具有重要意义。