From the Division of Trauma and General Surgery, Department of Surgery, University of Pittsburgh Medical Center, Pittsburgh, Pennsylvania.
J Trauma Acute Care Surg. 2021 Aug 1;91(2):399-405. doi: 10.1097/TA.0000000000003228.
Social vulnerability indices were created to measure resiliency to environmental disasters based on socioeconomic and population characteristics of discrete geographic regions. They are composed of multiple validated constructs that can also potentially identify geographically vulnerable populations after injury. Our objective was to determine if these indices correlate with injury fatality rates in the US.
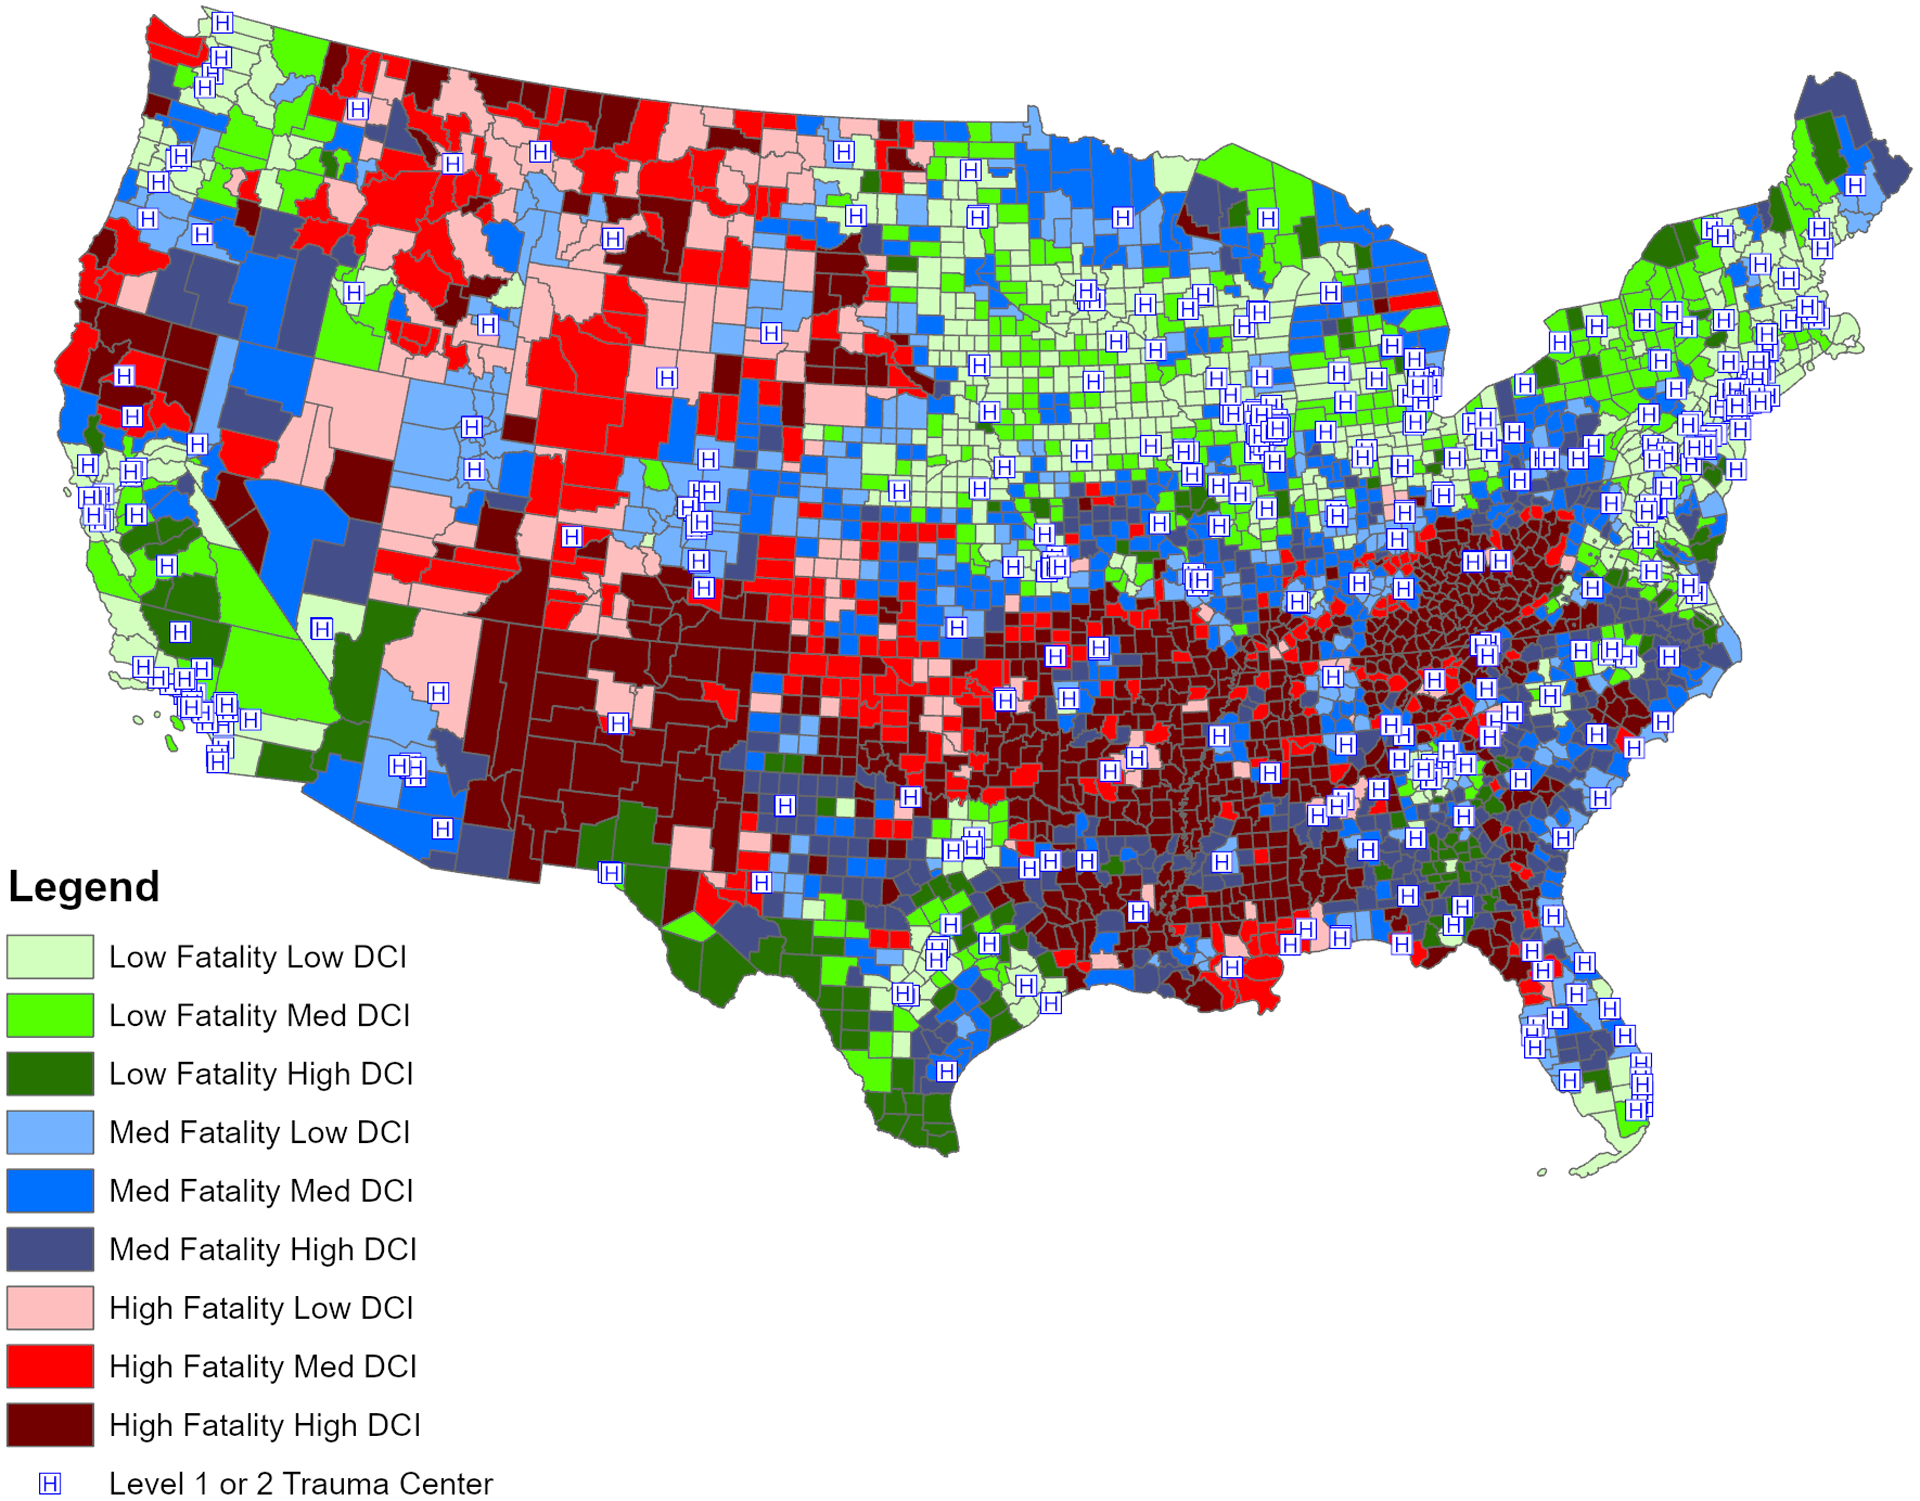
We evaluated three social vulnerability indices: The Hazards & Vulnerability Research Institute's Social Vulnerability Index (SoVI), the Center for Disease Control's Social Vulnerability Index (SVI), and the Economic Innovation Group's Distressed Community Index (DCI). We analyzed SVI subindices and common individual census variables as indicators of socioeconomic status. Outcomes included age-adjusted county-level overall, firearm, and motor vehicle collision deaths per 100,000 population. Linear regression determined the association of injury fatality rates with the SoVI, SVI, and DCI. Bivariate choropleth mapping identified geographic variation and spatial autocorrelation of overall fatality, SoVI, and DCI.
A total of 3,137 US counties were included. Only 24.6% of counties fell into the same vulnerability quintile for all three indices. Despite this, all indices were associated with increasing fatality rates for overall, firearm, and motor vehicle collision fatality. The DCI performed best by model fit, explanation of variance, and diagnostic performance on overall injury fatality. There is significant geographic variation in SoVI, DCI, and injury fatality rates at the county level across the United States, with moderate spatial autocorrelation of SoVI (Moran's I, 0.35; p < 0.01) and high autocorrelation of injury fatality rates (Moran's I, 0.77; p < 0.01) and DCI (Moran's I, 0.53; p < 0.01).
While the indices contribute unique information, higher social vulnerability is associated with higher injury fatality across all indices. These indices may be useful in the epidemiologic and geographic assessment of injury-related fatality rates. Further study is warranted to determine if these indices outperform traditional measures of socioeconomic status and related constructs used in trauma research.
Epidemiological, level IV.
社会脆弱性指数是根据离散地理区域的社会经济和人口特征创建的,用于衡量对环境灾害的恢复能力。它们由多个经过验证的结构组成,这些结构也可以在受伤后潜在地确定地理上脆弱的人群。我们的目标是确定这些指数是否与美国的伤害死亡率相关。
我们评估了三种社会脆弱性指数:灾害与脆弱性研究所的社会脆弱性指数(SoVI)、疾病控制中心的社会脆弱性指数(SVI)和经济创新集团的困境社区指数(DCI)。我们分析了 SVI 子指数和常见的人口普查变量,作为社会经济地位的指标。结果包括年龄调整后的县级总体、枪支和机动车碰撞死亡率(每 10 万人)。线性回归确定了伤害死亡率与 SoVI、SVI 和 DCI 的关联。双变量面块图确定了总体死亡率、SoVI 和 DCI 的地理变化和空间自相关。
共纳入 3137 个美国县。只有 24.6%的县在所有三个指数中属于同一脆弱性五分位数。尽管如此,所有指数都与总体、枪支和机动车碰撞死亡率的死亡率增加相关。DCI 在整体伤害死亡率的模型拟合、方差解释和诊断性能方面表现最佳。在美国,SoVI、DCI 和伤害死亡率在县级层面上存在显著的地理差异,SoVI(Moran's I,0.35;p < 0.01)和伤害死亡率(Moran's I,0.77;p < 0.01)和 DCI(Moran's I,0.53;p < 0.01)存在中度空间自相关。
虽然这些指数提供了独特的信息,但所有指数中,较高的社会脆弱性与较高的伤害死亡率相关。这些指数可能有助于伤害相关死亡率的流行病学和地理评估。需要进一步研究以确定这些指数是否优于传统的社会经济地位衡量标准以及创伤研究中使用的相关结构。
流行病学,四级。