• 文献检索
  • 文档翻译
  • 深度研究
  • 学术资讯
  • Suppr Zotero 插件Zotero 插件
  • 邀请有礼
  • 套餐&价格
  • 历史记录
应用&插件
Suppr Zotero 插件Zotero 插件浏览器插件Mac 客户端Windows 客户端微信小程序
定价
高级版会员购买积分包购买API积分包
服务
文献检索文档翻译深度研究API 文档MCP 服务
关于我们
关于 Suppr公司介绍联系我们用户协议隐私条款
关注我们

Suppr 超能文献

核心技术专利:CN118964589B侵权必究
粤ICP备2023148730 号-1Suppr @ 2026

文献检索

告别复杂PubMed语法,用中文像聊天一样搜索,搜遍4000万医学文献。AI智能推荐,让科研检索更轻松。

立即免费搜索

文件翻译

保留排版,准确专业,支持PDF/Word/PPT等文件格式,支持 12+语言互译。

免费翻译文档

深度研究

AI帮你快速写综述,25分钟生成高质量综述,智能提取关键信息,辅助科研写作。

立即免费体验

2008-2018 年 11 个西部州按县、ZIP 代码和普查地段划分的每日 PM 浓度估计值。

Daily PM concentration estimates by county, ZIP code, and census tract in 11 western states 2008-2018.

机构信息

Geography Department, Campus Box 260, University of Colorado Boulder, Boulder, CO, 80309, USA.

Earth Lab, 4001 Discovery Drive Suite S348 - UCB 611, University of Colorado Boulder, Boulder, CO, 80309, USA.

出版信息

Sci Data. 2021 Apr 19;8(1):112. doi: 10.1038/s41597-021-00891-1.

DOI:10.1038/s41597-021-00891-1
PMID:33875665
原文链接:https://pmc.ncbi.nlm.nih.gov/articles/PMC8055869/
Abstract

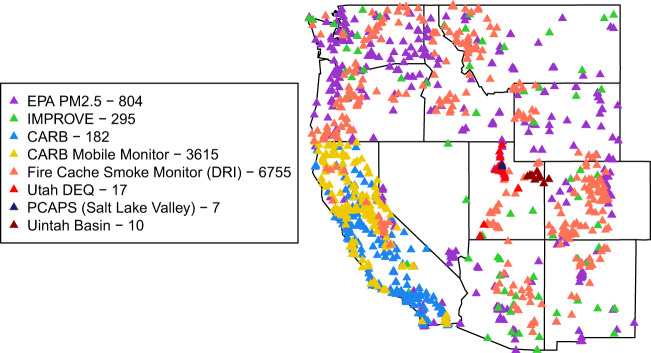
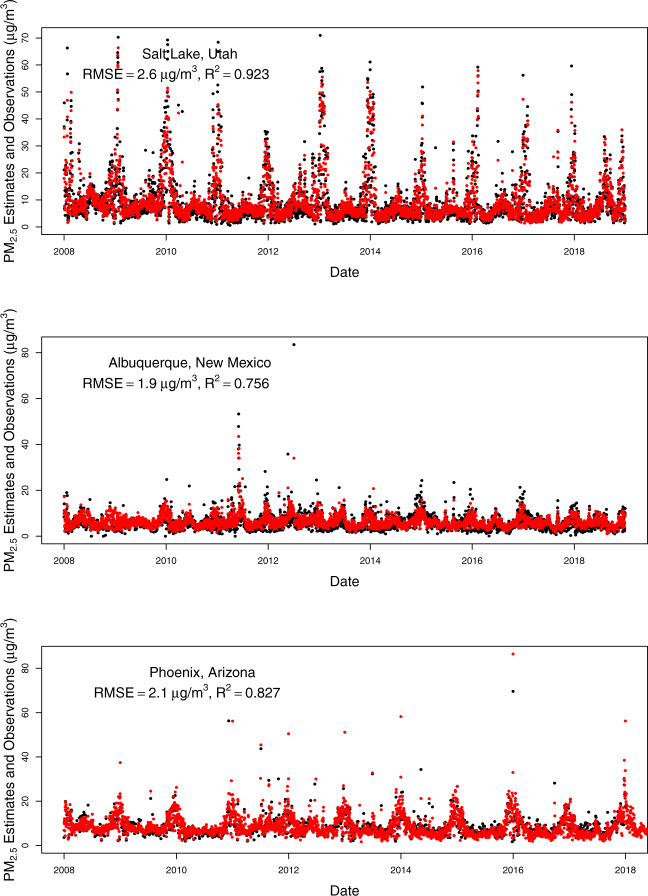
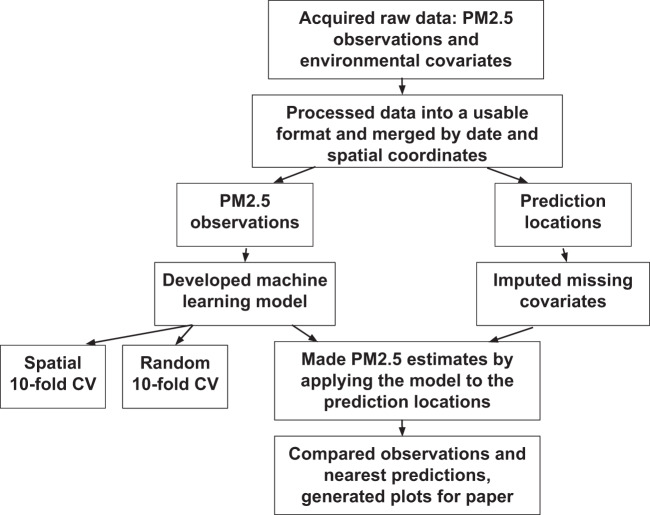
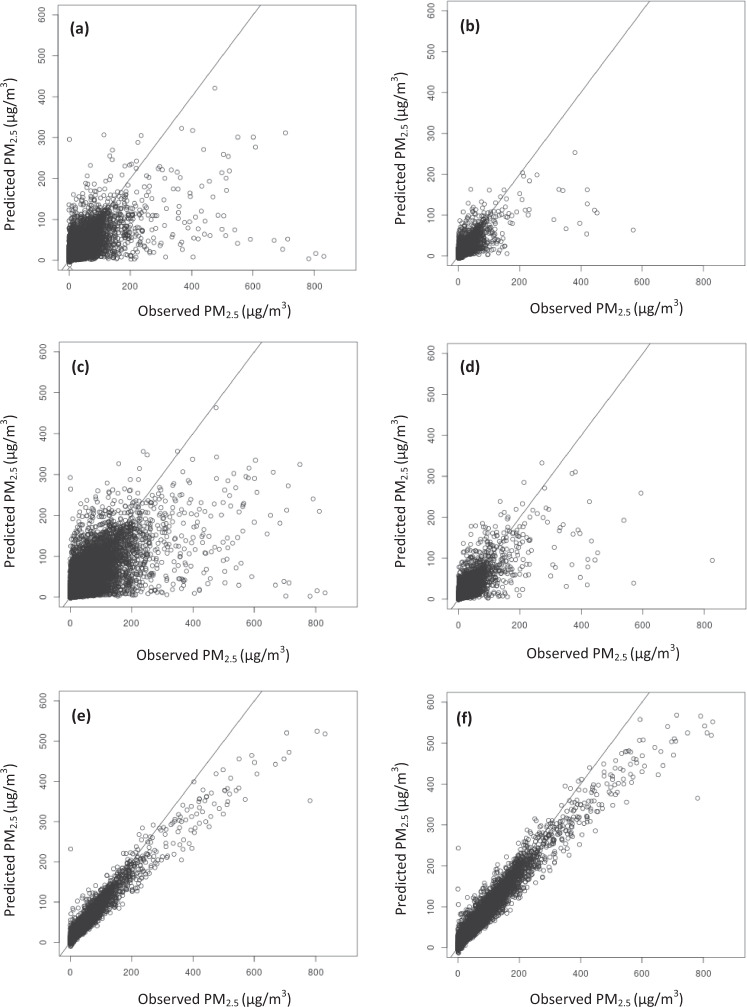
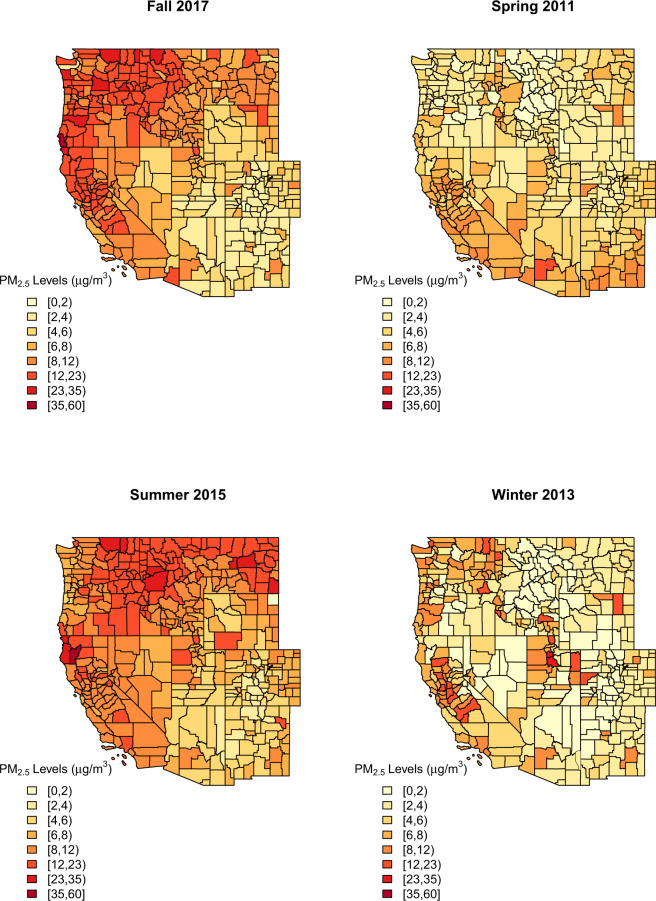
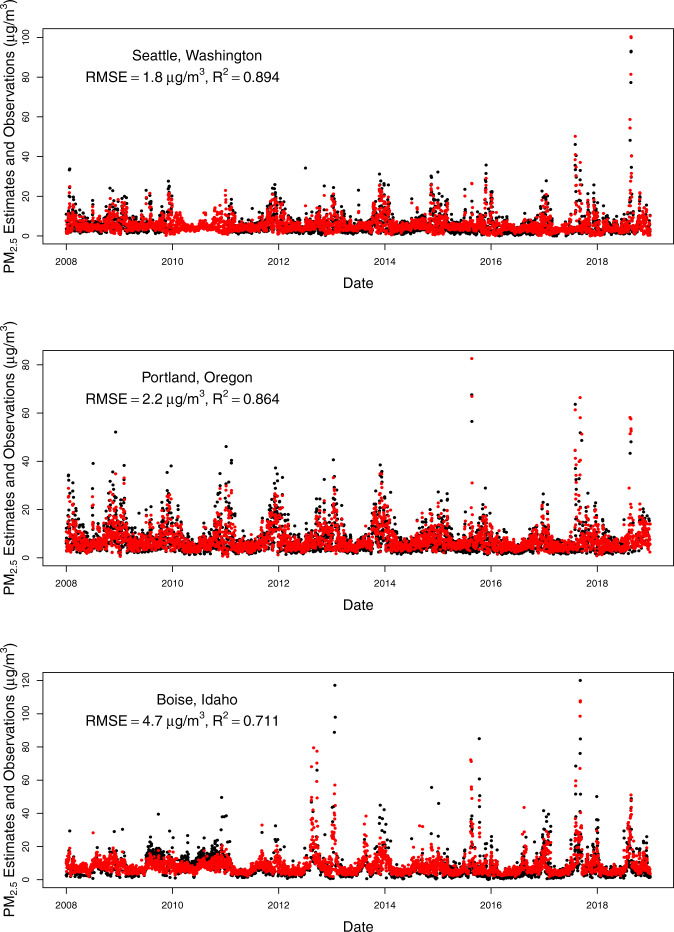
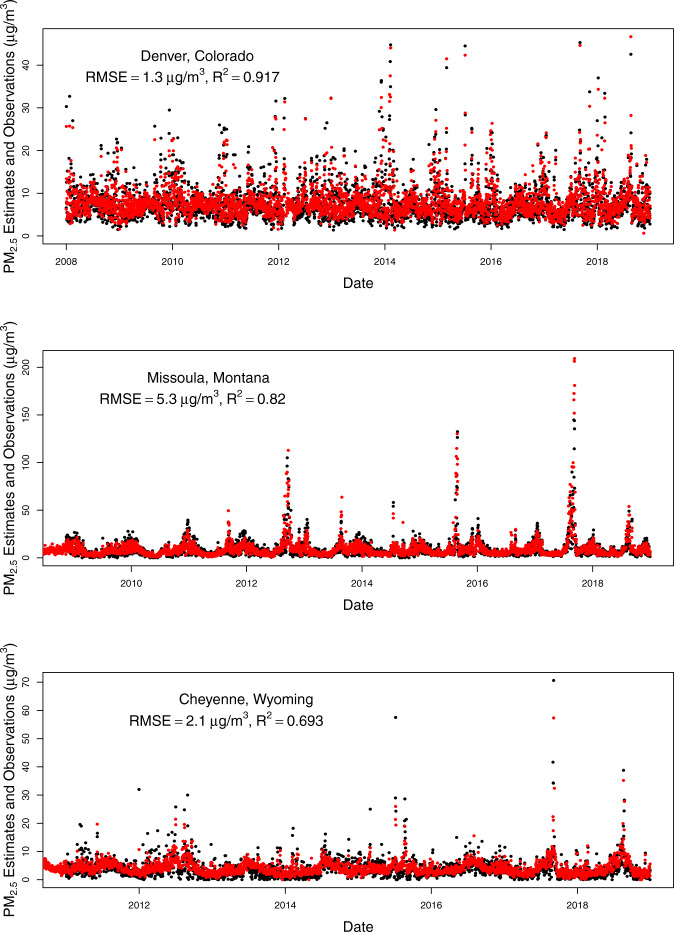
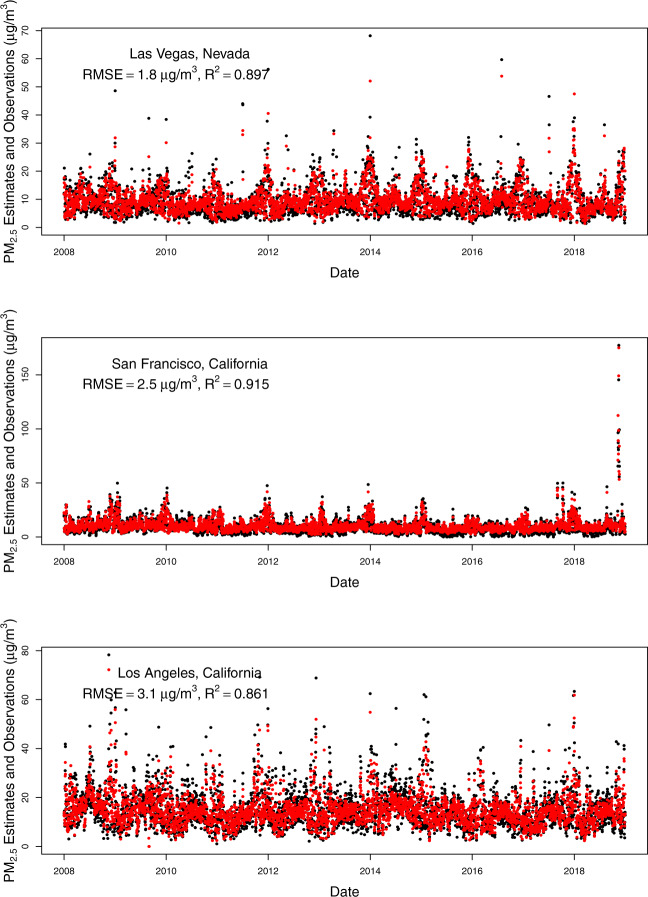
We created daily concentration estimates for fine particulate matter (PM) at the centroids of each county, ZIP code, and census tract across the western US, from 2008-2018. These estimates are predictions from ensemble machine learning models trained on 24-hour PM measurements from monitoring station data across 11 states in the western US. Predictor variables were derived from satellite, land cover, chemical transport model (just for the 2008-2016 model), and meteorological data. Ten-fold spatial and random CV R were 0.66 and 0.73, respectively, for the 2008-2016 model and 0.58 and 0.72, respectively for the 2008-2018 model. Comparing areal predictions to nearby monitored observations demonstrated overall R of 0.70 for the 2008-2016 model and 0.58 for the 2008-2018 model, but we observed higher R (>0.80) in many urban areas. These data can be used to understand spatiotemporal patterns of, exposures to, and health impacts of PM in the western US, where PM levels have been heavily impacted by wildfire smoke over this time period.

摘要

我们在美国西部创建了 2008-2018 年每日细颗粒物(PM)浓度的估计值,这些浓度以每个县、ZIP 编码和普查区的中心点为中心。这些估计值是基于美国西部 11 个州的监测站数据中 24 小时 PM 测量值,通过集合机器学习模型预测得出的。预测变量来自卫星、土地覆盖、化学传输模型(仅适用于 2008-2016 年模型)和气象数据。对于 2008-2016 年模型,空间和随机 CV R 值分别为 0.66 和 0.73,对于 2008-2018 年模型,空间和随机 CV R 值分别为 0.58 和 0.72。将面积预测与附近监测的观测值进行比较,结果表明,2008-2016 年模型的整体 R 值为 0.70,2008-2018 年模型的 R 值为 0.58,但我们观察到许多城市地区的 R 值更高(>0.80)。这些数据可用于了解美国西部 PM 的时空分布、暴露程度和对健康的影响,在此期间,PM 水平受到野火烟雾的严重影响。

https://cdn.ncbi.nlm.nih.gov/pmc/blobs/2642/8055869/e87e0a5dd002/41597_2021_891_Fig8_HTML.jpg
https://cdn.ncbi.nlm.nih.gov/pmc/blobs/2642/8055869/b4c7717ffa83/41597_2021_891_Fig1_HTML.jpg
https://cdn.ncbi.nlm.nih.gov/pmc/blobs/2642/8055869/72514418f6be/41597_2021_891_Fig2_HTML.jpg
https://cdn.ncbi.nlm.nih.gov/pmc/blobs/2642/8055869/e6b9eef9ef2e/41597_2021_891_Fig3_HTML.jpg
https://cdn.ncbi.nlm.nih.gov/pmc/blobs/2642/8055869/8249e76fba3a/41597_2021_891_Fig4_HTML.jpg
https://cdn.ncbi.nlm.nih.gov/pmc/blobs/2642/8055869/3f487b84b505/41597_2021_891_Fig5_HTML.jpg
https://cdn.ncbi.nlm.nih.gov/pmc/blobs/2642/8055869/82a08476e3a7/41597_2021_891_Fig6_HTML.jpg
https://cdn.ncbi.nlm.nih.gov/pmc/blobs/2642/8055869/c70b0eb8b50b/41597_2021_891_Fig7_HTML.jpg
https://cdn.ncbi.nlm.nih.gov/pmc/blobs/2642/8055869/e87e0a5dd002/41597_2021_891_Fig8_HTML.jpg

相似文献

1
Daily PM concentration estimates by county, ZIP code, and census tract in 11 western states 2008-2018.2008-2018 年 11 个西部州按县、ZIP 代码和普查地段划分的每日 PM 浓度估计值。
Sci Data. 2021 Apr 19;8(1):112. doi: 10.1038/s41597-021-00891-1.
2
An ensemble-based model of PM concentration across the contiguous United States with high spatiotemporal resolution.一种具有高时空分辨率的美国大陆地区 PM 浓度的集合模型。
Environ Int. 2019 Sep;130:104909. doi: 10.1016/j.envint.2019.104909. Epub 2019 Jul 1.
3
A novel ensemble-based statistical approach to estimate daily wildfire-specific PM in California (2006-2020).一种基于集合的新型统计方法,用于估计加利福尼亚州(2006-2020 年)的特定于野火的每日 PM。
Environ Int. 2023 Jan;171:107719. doi: 10.1016/j.envint.2022.107719. Epub 2022 Dec 24.
4
Assessment and statistical modeling of the relationship between remotely sensed aerosol optical depth and PM2.5 in the eastern United States.美国东部地区遥感气溶胶光学厚度与PM2.5之间关系的评估及统计建模
Res Rep Health Eff Inst. 2012 May(167):5-83; discussion 85-91.
5
Mortality-Air Pollution Associations in Low Exposure Environments (MAPLE): Phase 2.低暴露环境下死亡率与空气污染关联研究(MAPLE):第二阶段。
Res Rep Health Eff Inst. 2022 Jul;2022(212):1-91.
6
The Canadian Optimized Statistical Smoke Exposure Model (CanOSSEM): A machine learning approach to estimate national daily fine particulate matter (PM) exposure.加拿大优化统计烟雾暴露模型(CanOSSEM):一种用于估计全国每日细颗粒物(PM)暴露量的机器学习方法。
Sci Total Environ. 2022 Dec 1;850:157956. doi: 10.1016/j.scitotenv.2022.157956. Epub 2022 Aug 15.
7
Mortality-Air Pollution Associations in Low-Exposure Environments (MAPLE): Phase 1.低暴露环境下的死亡率与空气污染关联研究(MAPLE):第一阶段
Res Rep Health Eff Inst. 2019 Nov;2019(203):1-87.
8
Spatiotemporal continuous estimates of PM concentrations in China, 2000-2016: A machine learning method with inputs from satellites, chemical transport model, and ground observations.2000-2016 年中国 PM 浓度的时空连续估算:卫星、化学输送模型和地面观测输入的机器学习方法。
Environ Int. 2019 Feb;123:345-357. doi: 10.1016/j.envint.2018.11.075. Epub 2018 Dec 18.
9
Spatiotemporal prediction of fine particulate matter using high-resolution satellite images in the Southeastern US 2003-2011.利用2003 - 2011年美国东南部高分辨率卫星图像对细颗粒物进行时空预测
J Expo Sci Environ Epidemiol. 2016 Jun;26(4):377-84. doi: 10.1038/jes.2015.41. Epub 2015 Jun 17.
10
A comparison of linear regression, regularization, and machine learning algorithms to develop Europe-wide spatial models of fine particles and nitrogen dioxide.比较线性回归、正则化和机器学习算法,以建立欧洲范围内细颗粒物和二氧化氮的空间模型。
Environ Int. 2019 Sep;130:104934. doi: 10.1016/j.envint.2019.104934. Epub 2019 Jun 20.

引用本文的文献

1
Global disparities in indoor wildfire-PM exposure and mitigation costs.室内野火细颗粒物暴露及缓解成本的全球差异
Sci Adv. 2025 May 16;11(20):eads4360. doi: 10.1126/sciadv.ads4360. Epub 2025 May 14.
2
A State of the Science Review of Wildfire-Specific Fine Particulate Matter Data Sources, Methods, and Models.野火特定细颗粒物数据源、方法和模型的科学现状综述
Environ Health Perspect. 2025 Jun;133(6):66001. doi: 10.1289/EHP15672. Epub 2025 Jun 11.
3
Wildfire Smoke Exposure and Cause-Specific Hospitalization in Older Adults.老年人接触野火烟雾与特定病因住院情况

本文引用的文献

1
Spatial and temporal estimates of population exposure to wildfire smoke during the Washington state 2012 wildfire season using blended model, satellite, and in situ data.利用混合模型、卫星和实地数据对华盛顿州2012年野火季节期间人群暴露于野火烟雾的时空估计。
Geohealth. 2017 May 31;1(3):106-121. doi: 10.1002/2017GH000049. eCollection 2017 May.
2
Mapping Modeled Exposure of Wildland Fire Smoke for Human Health Studies in California.为加利福尼亚州人类健康研究绘制野火烟雾模拟暴露图。
Atmosphere (Basel). 2019 Jun;10(6). doi: 10.3390/atmos10060308. Epub 2019 Jun 4.
3
Estimating PM2.5 concentration of the conterminous United States via interpretable convolutional neural networks.
JAMA Netw Open. 2025 Apr 1;8(4):e257956. doi: 10.1001/jamanetworkopen.2025.7956.
4
Wildfire Air Pollution and Rates of Cardiovascular Events and Mortality in Northern California in 2018.2018年加利福尼亚州北部野火空气污染与心血管事件发生率及死亡率
J Am Heart Assoc. 2025 Feb 18;14(4):e036264. doi: 10.1161/JAHA.124.036264. Epub 2025 Feb 5.
5
National PM spatiotemporal model integrating intensive monitoring data and land use regression in a likelihood-based universal kriging framework in the United States: 2000-2019.在美国基于似然性的通用克里金框架下整合密集监测数据和土地利用回归的国家细颗粒物时空模型:2000 - 2019年
Environ Pollut. 2025 Feb 1;366:125405. doi: 10.1016/j.envpol.2024.125405. Epub 2024 Nov 28.
6
Mortality attributable to PM from wildland fires in California from 2008 to 2018.2008 年至 2018 年加利福尼亚州野火产生的 PM 所致死亡率。
Sci Adv. 2024 Jun 7;10(23):eadl1252. doi: 10.1126/sciadv.adl1252.
7
A city-level dataset of heavy metal emissions into the atmosphere across China from 2015-2020.2015-2020 年中国大气重金属排放的城市级数据集。
Sci Data. 2024 Feb 29;11(1):258. doi: 10.1038/s41597-024-03089-3.
8
Health Effects of Wildfire Smoke Exposure.野火烟雾暴露对健康的影响。
Annu Rev Med. 2024 Jan 29;75:277-292. doi: 10.1146/annurev-med-052422-020909. Epub 2023 Sep 22.
9
The contribution of wildfire to PM trends in the USA.美国野火对 PM 趋势的贡献。
Nature. 2023 Oct;622(7984):761-766. doi: 10.1038/s41586-023-06522-6. Epub 2023 Sep 20.
10
Evaluation of Model-Based PM Estimates for Exposure Assessment during Wildfire Smoke Episodes in the Western U.S.美国西部野火烟雾事件期间基于模型的 PM 估算值在暴露评估中的评估
Environ Sci Technol. 2023 Feb 7;57(5):2031-2041. doi: 10.1021/acs.est.2c06288. Epub 2023 Jan 24.
通过可解释卷积神经网络估算美国本土的 PM2.5 浓度。
Environ Pollut. 2020 Jan;256:113395. doi: 10.1016/j.envpol.2019.113395. Epub 2019 Oct 23.
4
Benefits of High Resolution PM Prediction using Satellite MAIAC AOD and Land Use Regression for Exposure Assessment: California Examples.利用卫星 MAIA C AOD 和土地利用回归进行高分辨率 PM 预测对暴露评估的益处:加利福尼亚州实例。
Environ Sci Technol. 2019 Nov 5;53(21):12774-12783. doi: 10.1021/acs.est.9b03799. Epub 2019 Oct 17.
5
Machine learning models accurately predict ozone exposure during wildfire events.机器学习模型能准确预测野火事件中的臭氧暴露情况。
Environ Pollut. 2019 Nov;254(Pt A):112792. doi: 10.1016/j.envpol.2019.06.088. Epub 2019 Jul 5.
6
Satellite-Based Daily PM Estimates During Fire Seasons in Colorado.科罗拉多州火灾季节基于卫星的每日颗粒物估计值
J Geophys Res Atmos. 2018 Aug 16;123(15):8159-8171. doi: 10.1029/2018JD028573. Epub 2018 Jul 13.
7
An ensemble-based model of PM concentration across the contiguous United States with high spatiotemporal resolution.一种具有高时空分辨率的美国大陆地区 PM 浓度的集合模型。
Environ Int. 2019 Sep;130:104909. doi: 10.1016/j.envint.2019.104909. Epub 2019 Jul 1.
8
Associations between respiratory health and ozone and fine particulate matter during a wildfire event.野火事件期间,呼吸系统健康与臭氧和细颗粒物的关联。
Environ Int. 2019 Aug;129:291-298. doi: 10.1016/j.envint.2019.04.033. Epub 2019 May 28.
9
Assessing exposure to outdoor air pollution for epidemiological studies: Model-based and personal sampling strategies.评估户外空气污染暴露的流行病学研究:基于模型和个人采样策略。
J Allergy Clin Immunol. 2019 Jun;143(6):2002-2006. doi: 10.1016/j.jaci.2019.04.019. Epub 2019 May 4.
10
Satellite-based high-resolution mapping of ground-level PM concentrations over East China using a spatiotemporal regression kriging model.利用时空回归克里金模型对中国东部地面PM浓度进行基于卫星的高分辨率制图。
Sci Total Environ. 2019 Jul 1;672:479-490. doi: 10.1016/j.scitotenv.2019.03.480. Epub 2019 Apr 2.