• 文献检索
  • 文档翻译
  • 深度研究
  • 学术资讯
  • Suppr Zotero 插件Zotero 插件
  • 邀请有礼
  • 套餐&价格
  • 历史记录
应用&插件
Suppr Zotero 插件Zotero 插件浏览器插件Mac 客户端Windows 客户端微信小程序
定价
高级版会员购买积分包购买API积分包
服务
文献检索文档翻译深度研究API 文档MCP 服务
关于我们
关于 Suppr公司介绍联系我们用户协议隐私条款
关注我们

Suppr 超能文献

核心技术专利:CN118964589B侵权必究
粤ICP备2023148730 号-1Suppr @ 2026

文献检索

告别复杂PubMed语法,用中文像聊天一样搜索,搜遍4000万医学文献。AI智能推荐,让科研检索更轻松。

立即免费搜索

文件翻译

保留排版,准确专业,支持PDF/Word/PPT等文件格式,支持 12+语言互译。

免费翻译文档

深度研究

AI帮你快速写综述,25分钟生成高质量综述,智能提取关键信息,辅助科研写作。

立即免费体验

老年夫妇和幸存配偶的预期寿命。

The life expectancy of older couples and surviving spouses.

机构信息

Department of Economics, University of Manitoba, Winnipeg, Manitoba, Canada.

Department of Economics and Olin School of Business, Washington University in St. Louis, St. Louis, Missouri, United States of America.

出版信息

PLoS One. 2021 May 14;16(5):e0250564. doi: 10.1371/journal.pone.0250564. eCollection 2021.

DOI:10.1371/journal.pone.0250564
PMID:33989281
原文链接:https://pmc.ncbi.nlm.nih.gov/articles/PMC8121294/
Abstract

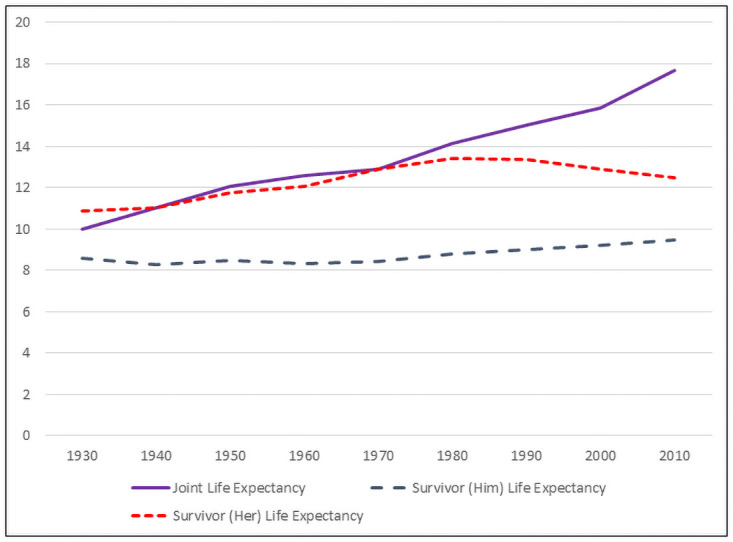
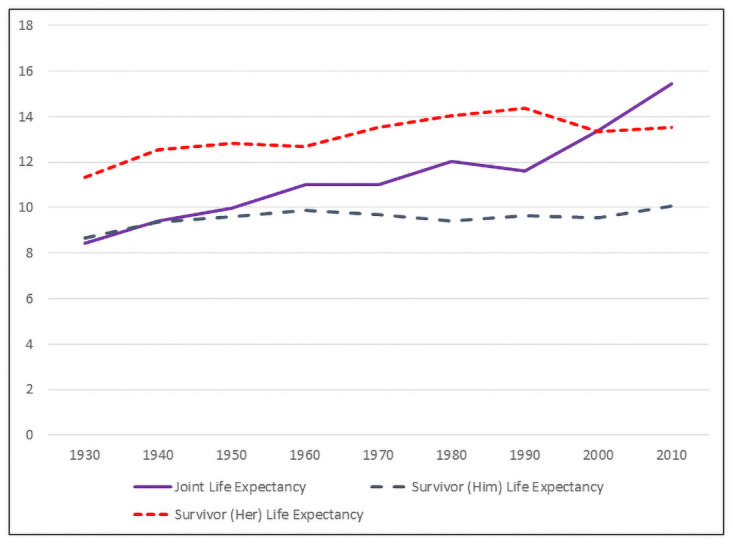
Individual life expectancies provide information for individuals making retirement decisions and for policy makers. For couples, analogous measures are the expected years both spouses will be alive (joint life expectancy) and the expected years the surviving spouse will be a widow or widower (survivor life expectancy). Using individual life expectancies to calculate summary measures for couples is intuitively appealing but yield misleading results, overstating joint life expectancy and dramatically understating survivor life expectancies. This implies that standard "individual life cycle models" are misleading for couples and that "couple life cycle models" must be substantially more complex. Using the CDC life tables for 2010, we construct joint and survivor life expectancy measures for randomly formed couples. The couples we form are defined by age, race and ethnicity, and education. Due to assortative marriage, inequalities in individual life expectancies are compounded into inequalities in joint and survivor life expectancies. We also calculate life expectancy measures for randomly formed couples for the 1930-2010 decennial years. Trends over time show how the relative rate of decrease in the mortality rates of men and women affect joint and survivor life expectancies. Because our couple life expectancy measures are based on randomly formed couples, they do not capture the effects of differences in spouses' premarital characteristics (apart from sex, age, race and ethnicity, and, in some cases, education) or of correlations in spouses' experiences or behaviors during marriage. However, they provide benchmarks which have been sorely lacking in the public discourse.

摘要

个人预期寿命为个人做出退休决策和政策制定者提供了信息。对于夫妇来说,类似的指标是夫妻双方预期的生存年限(联合预期寿命)和幸存配偶成为寡妇或鳏夫的预期年限(生存预期寿命)。使用个人预期寿命来计算夫妇的综合指标具有直观的吸引力,但会产生误导性的结果,夸大联合预期寿命,大大低估生存预期寿命。这意味着标准的“个人生命周期模型”对夫妇来说是具有误导性的,而“夫妇生命周期模型”必须更加复杂。我们使用 CDC 2010 年生命表,为随机形成的夫妇构建联合和生存预期寿命指标。我们形成的夫妇是根据年龄、种族和民族以及教育程度来定义的。由于婚姻的选择性,个人预期寿命的不平等会加剧联合和生存预期寿命的不平等。我们还为随机形成的夫妇计算了 1930 年至 2010 年十年间的预期寿命指标。随着时间的推移,趋势显示男女死亡率相对下降率如何影响联合和生存预期寿命。由于我们的夫妇预期寿命指标是基于随机形成的夫妇,因此它们不能捕捉到配偶婚前特征(除了性别、年龄、种族和民族以及在某些情况下的教育)差异或配偶在婚姻期间经历或行为的相关性的影响。然而,它们提供了在公共话语中严重缺乏的基准。

https://cdn.ncbi.nlm.nih.gov/pmc/blobs/557f/8121294/cfdb863caa15/pone.0250564.g002.jpg
https://cdn.ncbi.nlm.nih.gov/pmc/blobs/557f/8121294/199f44fec899/pone.0250564.g001.jpg
https://cdn.ncbi.nlm.nih.gov/pmc/blobs/557f/8121294/cfdb863caa15/pone.0250564.g002.jpg
https://cdn.ncbi.nlm.nih.gov/pmc/blobs/557f/8121294/199f44fec899/pone.0250564.g001.jpg
https://cdn.ncbi.nlm.nih.gov/pmc/blobs/557f/8121294/cfdb863caa15/pone.0250564.g002.jpg

相似文献

1
The life expectancy of older couples and surviving spouses.老年夫妇和幸存配偶的预期寿命。
PLoS One. 2021 May 14;16(5):e0250564. doi: 10.1371/journal.pone.0250564. eCollection 2021.
2
Using data for couples to project the distributional effects of changes in Social Security policy.利用夫妻数据来预测社会保障政策变化的分配效应。
Soc Secur Bull. 1999;62(3):20-7.
3
Do spouses coordinate their work exits? A combined survey and register analysis from Norway.配偶之间会协调他们的离职行为吗?来自挪威的一项综合调查与登记分析。
Res Aging. 2014 Sep;36(5):625-50. doi: 10.1177/0164027513516151. Epub 2014 Jan 20.
4
'Til Death Do Us Part: End-of-Life Experiences of Married Couples in a Nationally Representative Survey.《至死不渝:全国代表性调查中已婚夫妇的临终体验》。
J Am Geriatr Soc. 2018 Dec;66(12):2360-2366. doi: 10.1111/jgs.15573. Epub 2018 Sep 25.
5
Retirement and Changes in Housework: A Panel Study of Dual Earner Couples.退休与家务变化:双职工夫妇的面板研究。
J Gerontol B Psychol Sci Soc Sci. 2018 Apr 16;73(4):733-743. doi: 10.1093/geronb/gbw121.
6
What impact does hearing impairment have on cognitive health in older married couples in China?听力障碍对中国老年已婚夫妇的认知健康有何影响?
Soc Sci Med. 2024 Jul;352:116999. doi: 10.1016/j.socscimed.2024.116999. Epub 2024 May 17.
7
Gender differences in response to sexual expectancies and changes in sexual frequency: a short-term longitudinal study of sexual satisfaction in newly married couples.对性期望的反应及性交频率变化中的性别差异:新婚夫妇性满意度的短期纵向研究
Arch Sex Behav. 2008 Apr;37(2):229-40. doi: 10.1007/s10508-007-9176-1. Epub 2007 Jul 20.
8
Differences between husbands and wives in colonoscopy use: Results from a national sample of married couples.夫妻在结肠镜检查使用方面的差异:来自全国已婚夫妇样本的结果。
Prev Med. 2016 Jul;88:46-52. doi: 10.1016/j.ypmed.2016.03.011. Epub 2016 Mar 21.
9
Individual and spousal education, mortality and life expectancy in Switzerland: a national cohort study.瑞士的个人及配偶受教育程度、死亡率和预期寿命:一项全国队列研究。
J Epidemiol Community Health. 2014 Sep;68(9):804-10. doi: 10.1136/jech-2013-203714. Epub 2014 Apr 24.
10
The effect of revised populations on mortality statistics for the United States, 2000.2000年美国人口修订对死亡率统计数据的影响。
Natl Vital Stat Rep. 2003 Jun 5;51(9):1-24.

引用本文的文献

1
Utilization of elderly health promotion services during COVID 19 in Iran: A cross-sectional study.伊朗新冠疫情期间老年人健康促进服务的利用情况:一项横断面研究。
J Educ Health Promot. 2022 Sep 28;11:297. doi: 10.4103/jehp.jehp_1315_21. eCollection 2022.
2
Factors associated with mortality of the elderly due to ambulatory care sensitive conditions, between 2008 and 2018, in the Federal District, Brazil.2008 年至 2018 年期间,巴西联邦区导致老年人因可在门诊治疗的慢性病而死亡的相关因素。
PLoS One. 2022 Aug 5;17(8):e0272650. doi: 10.1371/journal.pone.0272650. eCollection 2022.
3
Probability of males to outlive females: an international comparison from 1751 to 2020.

本文引用的文献

1
XX > XY?: The changing female advantage in life expectancy.XX>XY:预期寿命中女性优势的变化。
J Health Econ. 2019 Sep;67:102224. doi: 10.1016/j.jhealeco.2019.102224. Epub 2019 Aug 10.
2
The Methuselah Effect: The Pernicious Impact of Unreported Deaths on Old-Age Mortality Estimates.玛士撒拉效应:未报告死亡对老年死亡率估计的有害影响。
Demography. 2017 Dec;54(6):2001-2024. doi: 10.1007/s13524-017-0623-x.
3
The Association Between Income and Life Expectancy in the United States, 2001-2014.2001 - 2014年美国收入与预期寿命之间的关联
男性预期寿命超过女性的概率:1751 年至 2020 年的国际比较。
BMJ Open. 2022 Aug 2;12(8):e059964. doi: 10.1136/bmjopen-2021-059964.
JAMA. 2016 Apr 26;315(16):1750-66. doi: 10.1001/jama.2016.4226.
4
Will the Latino Mortality Advantage Endure?拉丁裔的死亡率优势会持续下去吗?
Res Aging. 2016 Apr;38(3):263-82. doi: 10.1177/0164027515620242.
5
Trends in Life Expectancy and Lifespan Variation by Educational Attainment: United States, 1990-2010.按教育程度划分的预期寿命和寿命差异趋势:美国,1990 - 2010年
Demography. 2016 Apr;53(2):269-93. doi: 10.1007/s13524-015-0453-7.
6
Measuring Recent Apparent Declines In Longevity: The Role Of Increasing Educational Attainment.衡量近期预期寿命的明显下降:教育程度提高所起的作用。
Health Aff (Millwood). 2015 Dec;34(12):2167-73. doi: 10.1377/hlthaff.2015.0481.
7
Trends in U.S. life expectancy gradients: the role of changing educational composition.美国预期寿命梯度的趋势:教育构成变化的作用。
Int J Epidemiol. 2015 Jun;44(3):946-55. doi: 10.1093/ije/dyv062. Epub 2015 May 4.
8
Education reporting and classification on death certificates in the United States.美国死亡证明书中的死因报告与分类
Vital Health Stat 2. 2010 May(151):1-21.
9
Differences in life expectancy due to race and educational differences are widening, and many may not catch up.由于种族和教育差异导致的预期寿命差异正在扩大,许多人可能无法赶上。
Health Aff (Millwood). 2012 Aug;31(8):1803-13. doi: 10.1377/hlthaff.2011.0746.
10
Social Security and the Retirement and Savings Behavior of Low Income Households.社会保障与低收入家庭的退休及储蓄行为
J Econom. 2008 Jul;145(1-2):21-42. doi: 10.1016/j.jeconom.2008.05.004.