MMWR Morb Mortal Wkly Rep. 2021 Jun 4;70(22):818-824. doi: 10.15585/mmwr.mm7022e1.
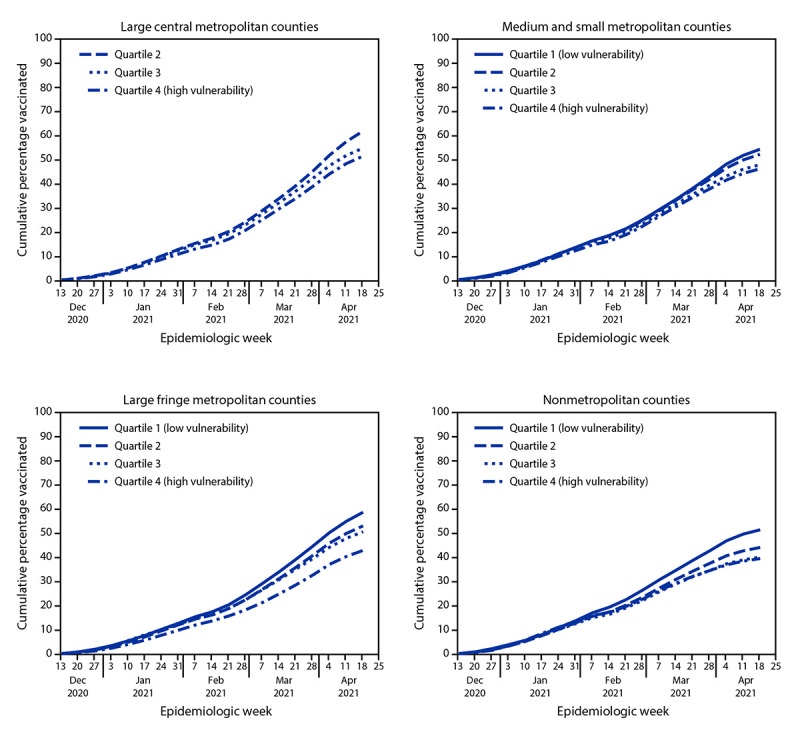
Disparities in vaccination coverage by social vulnerability, defined as social and structural factors associated with adverse health outcomes, were noted during the first 2.5 months of the U.S. COVID-19 vaccination campaign, which began during mid-December 2020 (1). As vaccine eligibility and availability continue to expand, assuring equitable coverage for disproportionately affected communities remains a priority. CDC examined COVID-19 vaccine administration and 2018 CDC social vulnerability index (SVI) data to ascertain whether inequities in COVID-19 vaccination coverage with respect to county-level SVI have persisted, overall and by urbanicity. Vaccination coverage was defined as the number of persons aged ≥18 years (adults) who had received ≥1 dose of any Food and Drug Administration (FDA)-authorized COVID-19 vaccine divided by the total adult population in a specified SVI category. SVI was examined overall and by its four themes (socioeconomic status, household composition and disability, racial/ethnic minority status and language, and housing type and transportation). Counties were categorized into SVI quartiles, in which quartile 1 (Q1) represented the lowest level of vulnerability and quartile 4 (Q4), the highest. Trends in vaccination coverage were assessed by SVI quartile and urbanicity, which was categorized as large central metropolitan, large fringe metropolitan (areas surrounding large cities, e.g., suburban), medium and small metropolitan, and nonmetropolitan counties. During December 14, 2020-May 1, 2021, disparities in vaccination coverage by SVI increased, especially in large fringe metropolitan (e.g., suburban) and nonmetropolitan counties. By May 1, 2021, vaccination coverage was lower among adults living in counties with the highest overall SVI; differences were most pronounced in large fringe metropolitan (Q4 coverage = 45.0% versus Q1 coverage = 61.7%) and nonmetropolitan (Q4 = 40.6% versus Q1 = 52.9%) counties. Vaccination coverage disparities were largest for two SVI themes: socioeconomic status (Q4 = 44.3% versus Q1 = 61.0%) and household composition and disability (Q4 = 42.0% versus Q1 = 60.1%). Outreach efforts, including expanding public health messaging tailored to local populations and increasing vaccination access, could help increase vaccination coverage in high-SVI counties.
在 2020 年 12 月中旬开始的美国 COVID-19 疫苗接种运动的头 2.5 个月期间,注意到社会脆弱性(定义为与不良健康结果相关的社会和结构性因素)导致疫苗接种覆盖率存在差异。随着疫苗资格和供应的不断扩大,确保受影响不成比例的社区获得公平覆盖仍然是当务之急。CDC 检查了 COVID-19 疫苗接种管理和 2018 年 CDC 社会脆弱性指数 (SVI) 数据,以确定县级 SVI 方面 COVID-19 疫苗接种覆盖率的不平等是否持续存在,以及总体情况和城市情况。疫苗接种覆盖率的定义为≥18 岁(成年人)中已接种≥1 剂任何 FDA 授权的 COVID-19 疫苗的人数除以特定 SVI 类别的成年总人口。SVI 整体以及四个主题(社会经济地位、家庭构成和残疾、种族/族裔少数群体地位和语言以及住房类型和交通)进行了检查。各县分为 SVI 四分位数,其中四分位数 1(Q1)代表最低脆弱性,四分位数 4(Q4)代表最高脆弱性。通过 SVI 四分位数和城市性评估了疫苗接种覆盖率的趋势,城市性分为大型中心大都市、大型边缘大都市(大城市周围的区域,例如郊区)、中型和小型大都市以及非大都市县。在 2020 年 12 月 14 日至 2021 年 5 月 1 日期间,SVI 导致的疫苗接种覆盖率差异增加,尤其是在大型边缘大都市(例如郊区)和非大都市县。到 2021 年 5 月 1 日,生活在整体 SVI 最高的县的成年人的疫苗接种率较低;在大型边缘大都市(Q4 覆盖率=45.0%,而 Q1 覆盖率=61.7%)和非大都市(Q4=40.6%,而 Q1=52.9%)县的差异最为明显。SVI 有两个主题的疫苗接种覆盖率差异最大:社会经济地位(Q4=44.3%,而 Q1=61.0%)和家庭构成和残疾(Q4=42.0%,而 Q1=60.1%)。扩大针对当地人群的公共卫生宣传和增加疫苗接种机会等外展工作,可以帮助提高高 SVI 县的疫苗接种率。