Department of Neurological Surgery, University of Virginia Health System, Charlottesville, VA, USA.
Department of Neurosurgery, Fondazione IRCCS Istituto Neurologico C. Besta, Milan, Italy.
Sci Rep. 2021 Jun 3;11(1):11797. doi: 10.1038/s41598-021-91252-w.
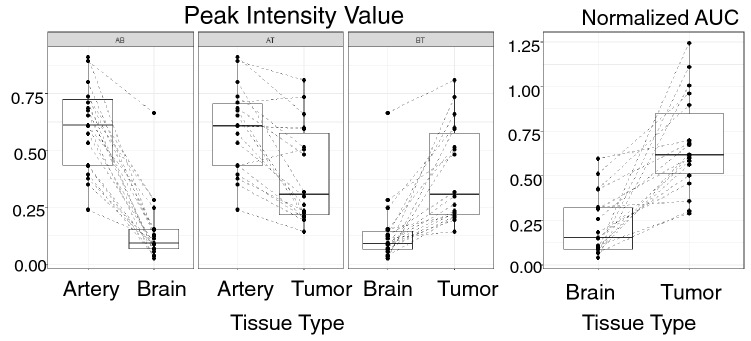
Microbubbles (MB) are widely used as contrast agents to perform contrast-enhanced ultrasound (CEUS) imaging and as acoustic amplifiers of mechanical bioeffects incited by therapeutic-level ultrasound. The distribution of MBs in the brain is not yet fully understood, thereby limiting intra-operative CEUS guidance or MB-based FUS treatments. In this paper we describe a robust platform for quantification of MB distribution in the human brain, allowing to quantitatively discriminate between tumoral and normal brain tissues and we provide new information regarding real-time cerebral MBs distribution. Intraoperative CEUS imaging was performed during surgical tumor resection using an ultrasound machine (MyLab Twice, Esaote, Italy) equipped with a multifrequency (3-11 MHz) linear array probe (LA332) and a specific low mechanical index (MI < 0.4) CEUS algorithm (CnTi, Esaote, Italy; section thickness, 0.245 cm) for non-destructive continuous MBs imaging. CEUS acquisition is started by enabling the CnTI PEN-M algorithm automatically setting the MI at 0.4 with a center frequency of 2.94 MHz-10 Hz frame rate at 80 mm-allowing for continuous non-destructive MBs imaging. 19 ultrasound image sets of adequate length were selected and retrospectively analyzed using a custom image processing software for quantitative analysis of echo power. Regions of interest (ROIs) were drawn on key structures (artery-tumor-white matter) by a blinded neurosurgeon, following which peak enhancement and time intensity curves (TICs) were quantified. CEUS images revealed clear qualitative differences in MB distribution: arteries showed the earliest and highest enhancement among all structures, followed by tumor and white matter regions, respectively. The custom software built for quantitative analysis effectively captured these differences. Quantified peak intensities showed regions containing artery, tumor or white matter structures having an average MB intensity of 0.584, 0.436 and 0.175 units, respectively. Moreover, the normalized area under TICs revealed the time of flight for MB to be significantly lower in brain tissue as compared with tumor tissue. Significant heterogeneities in TICs were also observed within different regions of the same brain lesion. In this study, we provide the most comprehensive strategy for accurate quantitative analysis of MBs distribution in the human brain by means of CEUS intraoperative imaging. Furthermore our results demonstrate that CEUS imaging quantitative analysis enables discernment between different types of brain tumors as well as regions and structures within the brain. Similar considerations will be important for the planning and implementation of MB-based imaging or treatments in the future.
微泡(MB)广泛用作对比剂以进行对比增强超声(CEUS)成像,并用作治疗水平超声激发的机械生物效应的声放大器。MB 在大脑中的分布尚不完全清楚,从而限制了术中 CEUS 引导或基于 MB 的 FUS 治疗。在本文中,我们描述了一种用于量化人脑内 MB 分布的强大平台,该平台允许定量区分肿瘤和正常脑组织,并提供有关实时脑 MB 分布的新信息。在手术肿瘤切除过程中,使用配备多频(3-11MHz)线性阵列探头(LA332)和特定低机械指数(MI<0.4)CEUS 算法(CnTi,Esaote,意大利; 切片厚度,0.245cm)的超声机(MyLab Twice,Esaote,意大利)进行术中 CEUS 成像,以进行非破坏性连续 MB 成像。通过启用 CnTI PEN-M 算法自动将 MI 设置为 0.4,并将中心频率设置为 2.94MHz-10Hz 的帧速率设置为 80mm,从而开始 CEUS 采集-允许进行连续的非破坏性 MB 成像。选择了 19 个足够长度的超声图像集,并使用定制的图像处理软件进行回顾性分析,以进行回声功率的定量分析。由一位盲法神经外科医生在关键结构(动脉-肿瘤-白质)上绘制感兴趣区域(ROI),然后量化峰值增强和时间强度曲线(TIC)。CEUS 图像显示出 MB 分布的明显定性差异:动脉在所有结构中显示出最早和最高的增强,其次是肿瘤和白质区域。为定量分析而构建的定制软件有效地捕获了这些差异。量化的峰值强度表明,包含动脉,肿瘤或白质结构的区域的平均 MB 强度分别为 0.584、0.436 和 0.175 个单位。此外,TIC 的归一化面积揭示了 MB 到达脑组织的飞行时间明显低于肿瘤组织。在同一脑病变的不同区域中,也观察到 TIC 的明显异质性。在这项研究中,我们通过术中 CEUS 成像提供了最全面的策略,用于准确分析人脑内 MB 的分布。此外,我们的结果表明,CEUS 成像定量分析能够区分不同类型的脑肿瘤以及大脑内的区域和结构。未来在基于 MB 的成像或治疗的计划和实施中,类似的考虑因素将很重要。