• 文献检索
  • 文档翻译
  • 深度研究
  • 学术资讯
  • Suppr Zotero 插件Zotero 插件
  • 邀请有礼
  • 套餐&价格
  • 历史记录
应用&插件
Suppr Zotero 插件Zotero 插件浏览器插件Mac 客户端Windows 客户端微信小程序
定价
高级版会员购买积分包购买API积分包
服务
文献检索文档翻译深度研究API 文档MCP 服务
关于我们
关于 Suppr公司介绍联系我们用户协议隐私条款
关注我们

Suppr 超能文献

核心技术专利:CN118964589B侵权必究
粤ICP备2023148730 号-1Suppr @ 2026

文献检索

告别复杂PubMed语法,用中文像聊天一样搜索,搜遍4000万医学文献。AI智能推荐,让科研检索更轻松。

立即免费搜索

文件翻译

保留排版,准确专业,支持PDF/Word/PPT等文件格式,支持 12+语言互译。

免费翻译文档

深度研究

AI帮你快速写综述,25分钟生成高质量综述,智能提取关键信息,辅助科研写作。

立即免费体验

根据存在数据和背景数据绘制接收器操作特征曲线和精确召回率曲线。

Plotting receiver operating characteristic and precision-recall curves from presence and background data.

作者信息

Li Wenkai, Guo Qinghua

机构信息

Guangdong Provincial Engineering Research Center for Remote Sensing and Monitoring of Water Environment School of Geography and Planning Sun Yat-Sen University Guangzhou China.

Institute of Ecology College of Urban and Environmental Sciences Peking University Beijing China.

出版信息

Ecol Evol. 2021 Jul 1;11(15):10192-10206. doi: 10.1002/ece3.7826. eCollection 2021 Aug.

DOI:10.1002/ece3.7826
PMID:34367569
原文链接:https://pmc.ncbi.nlm.nih.gov/articles/PMC8328458/
Abstract

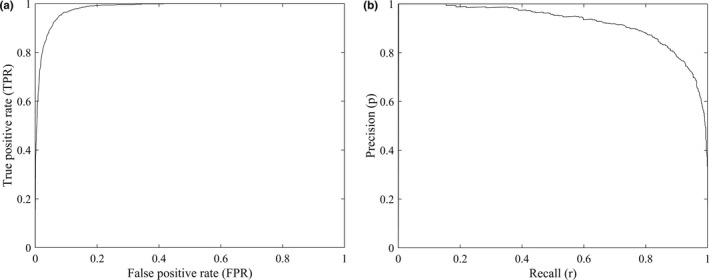
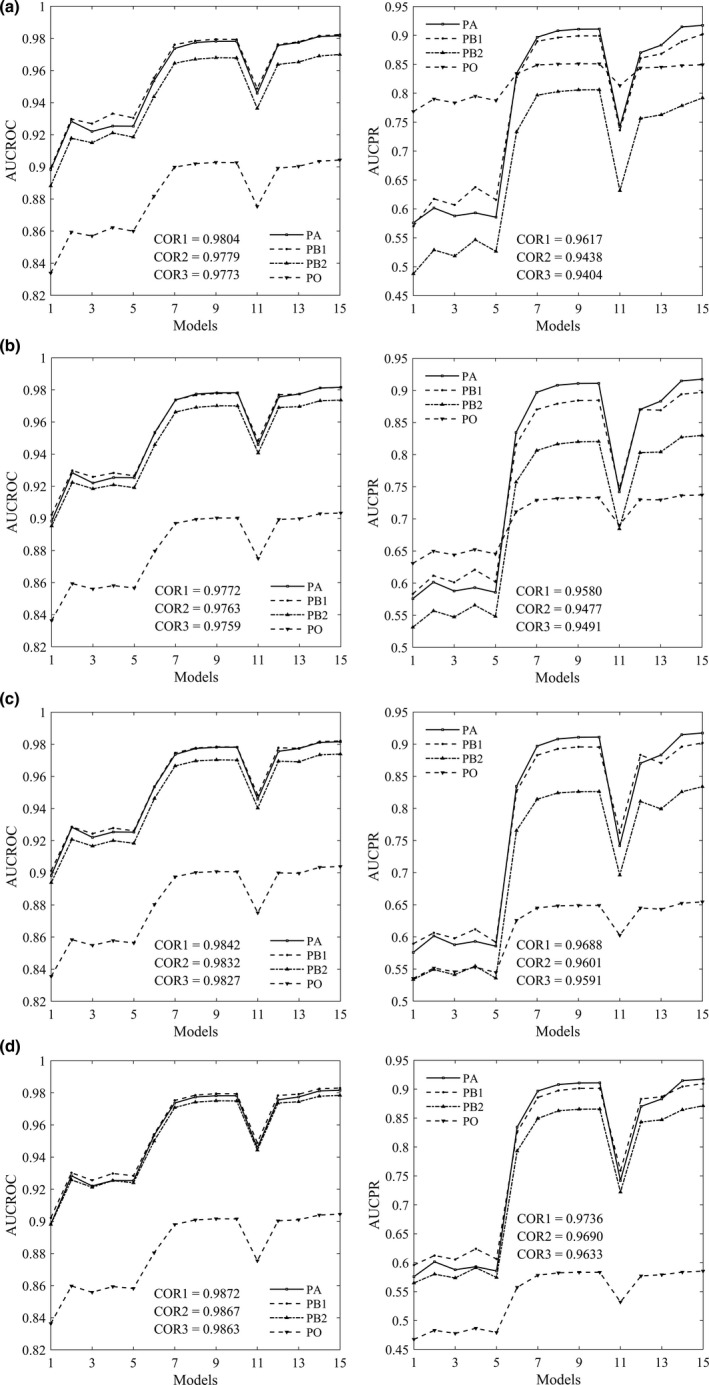
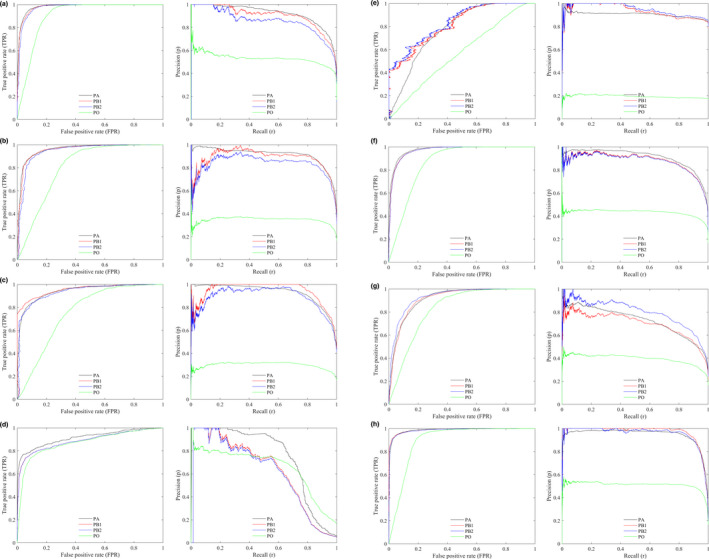
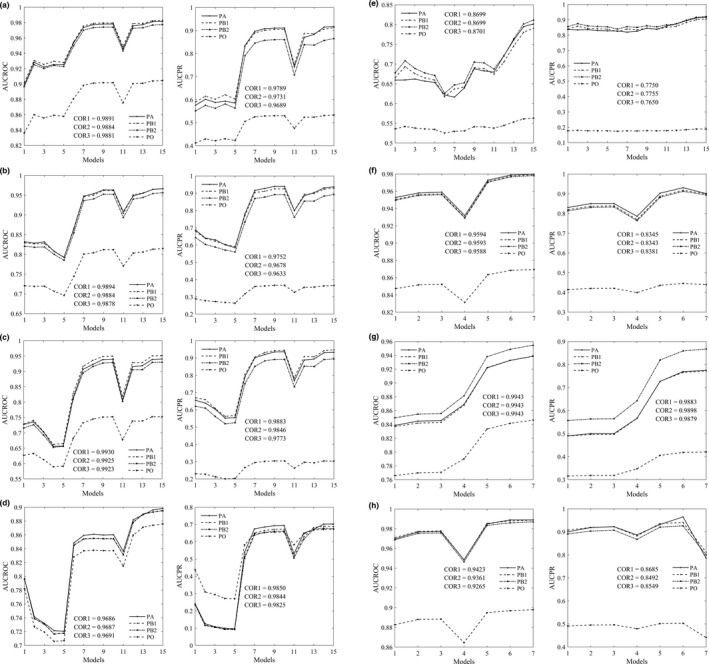
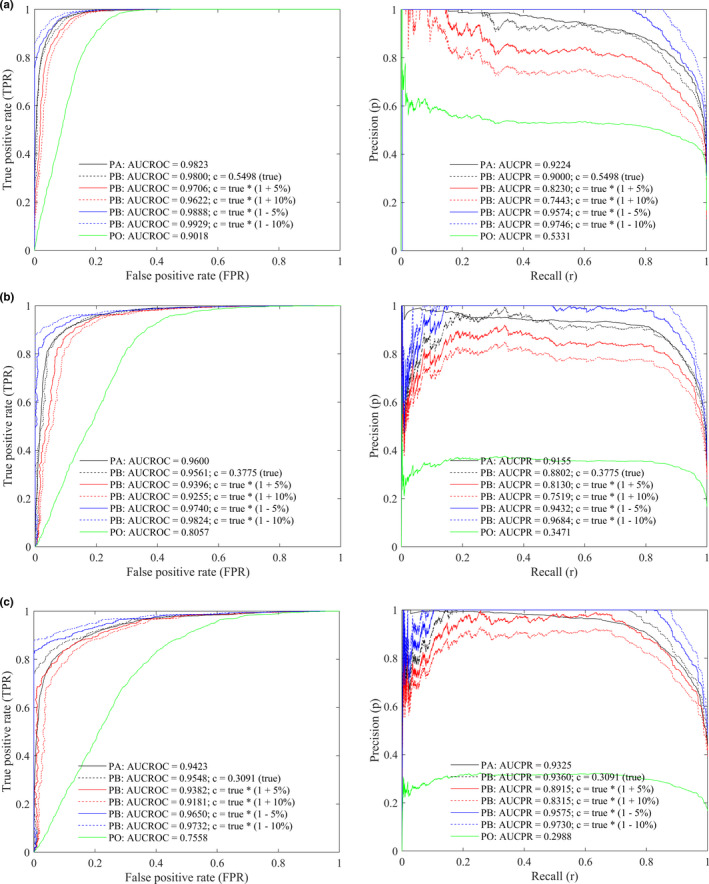
The receiver operating characteristic (ROC) and precision-recall (PR) plots have been widely used to evaluate the performance of species distribution models. Plotting the ROC/PR curves requires a traditional test set with both presence and absence data (namely PA approach), but species absence data are usually not available in reality. Plotting the ROC/PR curves from presence-only data while treating background data as pseudo absence data (namely PO approach) may provide misleading results.In this study, we propose a new approach to calibrate the ROC/PR curves from presence and background data with user-provided information on a constant , namely PB approach. Here, defines the probability that species occurrence is detected (labeled), and an estimate of can also be derived from the PB-based ROC/PR plots given that a model with good ability of discrimination is available. We used five virtual species and a real aerial photography to test the effectiveness of the proposed PB-based ROC/PR plots. Different models (or classifiers) were trained from presence and background data with various sample sizes. The ROC/PR curves plotted by PA approach were used to benchmark the curves plotted by PO and PB approaches.Experimental results show that the curves and areas under curves by PB approach are more similar to that by PA approach as compared with PO approach. The PB-based ROC/PR plots also provide highly accurate estimations of in our experiment.We conclude that the proposed PB-based ROC/PR plots can provide valuable complements to the existing model assessment methods, and they also provide an additional way to estimate the constant (or species prevalence) from presence and background data.

摘要

接收者操作特征(ROC)曲线和精确召回率(PR)曲线已被广泛用于评估物种分布模型的性能。绘制ROC/PR曲线需要一个同时包含存在和缺失数据的传统测试集(即PA方法),但在现实中物种缺失数据通常不可用。仅根据存在数据绘制ROC/PR曲线,同时将背景数据视为伪缺失数据(即PO方法)可能会产生误导性结果。在本研究中,我们提出了一种新方法,即利用用户提供的关于常数的信息,从存在数据和背景数据校准ROC/PR曲线,即PB方法。这里,定义了检测到(标记)物种出现的概率,并且如果有一个具有良好判别能力的模型,也可以从基于PB的ROC/PR图中得出的估计值。我们使用了五个虚拟物种和一张真实航空照片来测试所提出的基于PB的ROC/PR图的有效性。使用不同样本量的存在数据和背景数据训练不同的模型(或分类器)。用PA方法绘制的ROC/PR曲线用于作为PO和PB方法绘制曲线的基准。实验结果表明,与PO方法相比,PB方法绘制的曲线和曲线下面积与PA方法绘制的更相似。在我们的实验中,基于PB的ROC/PR图也提供了对的高度准确估计。我们得出结论,所提出的基于PB的ROC/PR图可以为现有模型评估方法提供有价值的补充,并且它们还提供了一种从存在数据和背景数据估计常数(或物种患病率)的额外方法。

https://cdn.ncbi.nlm.nih.gov/pmc/blobs/1f62/8328458/26a4e60abae1/ECE3-11-10192-g004.jpg
https://cdn.ncbi.nlm.nih.gov/pmc/blobs/1f62/8328458/ee826e55badb/ECE3-11-10192-g006.jpg
https://cdn.ncbi.nlm.nih.gov/pmc/blobs/1f62/8328458/9eac05908c66/ECE3-11-10192-g001.jpg
https://cdn.ncbi.nlm.nih.gov/pmc/blobs/1f62/8328458/c3a2d3318b59/ECE3-11-10192-g002.jpg
https://cdn.ncbi.nlm.nih.gov/pmc/blobs/1f62/8328458/21c2c4e2d882/ECE3-11-10192-g003.jpg
https://cdn.ncbi.nlm.nih.gov/pmc/blobs/1f62/8328458/26a4e60abae1/ECE3-11-10192-g004.jpg

相似文献

1
Plotting receiver operating characteristic and precision-recall curves from presence and background data.根据存在数据和背景数据绘制接收器操作特征曲线和精确召回率曲线。
Ecol Evol. 2021 Jul 1;11(15):10192-10206. doi: 10.1002/ece3.7826. eCollection 2021 Aug.
2
PRROC: computing and visualizing precision-recall and receiver operating characteristic curves in R.PRROC:在R语言中计算和可视化精确率-召回率曲线及接收器操作特性曲线
Bioinformatics. 2015 Aug 1;31(15):2595-7. doi: 10.1093/bioinformatics/btv153. Epub 2015 Mar 24.
3
[Application of ROC and PR curves in the evaluation of clinical diagnostic testing].[ROC曲线和PR曲线在临床诊断检测评估中的应用]
Zhonghua Yu Fang Yi Xue Za Zhi. 2022 Sep 6;56(9):1341-1347. doi: 10.3760/cma.j.cn112150-20220104-00007.
4
plotROC: A Tool for Plotting ROC Curves.绘制ROC曲线的工具:plotROC
J Stat Softw. 2017 Aug;79. doi: 10.18637/jss.v079.c02. Epub 2017 Aug 9.
5
A new concordant partial AUC and partial c statistic for imbalanced data in the evaluation of machine learning algorithms.不平衡数据中机器学习算法评估的新一致性部分 AUC 和部分 c 统计量。
BMC Med Inform Decis Mak. 2020 Jan 6;20(1):4. doi: 10.1186/s12911-019-1014-6.
6
Receiver Operating Characteristic (ROC) Curves: The Basics and Beyond.受试者工作特征(ROC)曲线:基础与进阶。
Hosp Pediatr. 2024 Jul 1;14(7):e330-e334. doi: 10.1542/hpeds.2023-007462.
7
ROC curves for clinical prediction models part 1. ROC plots showed no added value above the AUC when evaluating the performance of clinical prediction models.受试者工作特征曲线在临床预测模型中的应用(一):评估临床预测模型性能时,ROC 曲线在 AUC 之上并未显示出附加价值。
J Clin Epidemiol. 2020 Oct;126:207-216. doi: 10.1016/j.jclinepi.2020.01.028. Epub 2020 Jul 23.
8
Limitations of receiver operating characteristic curve on imbalanced data: Assist device mortality risk scores.接收器操作特性曲线在不平衡数据上的局限性:辅助设备死亡率风险评分。
J Thorac Cardiovasc Surg. 2023 Apr;165(4):1433-1442.e2. doi: 10.1016/j.jtcvs.2021.07.041. Epub 2021 Jul 30.
9
The average receiver operating characteristic curve in multireader multicase imaging studies.多阅片者多病例影像研究中的平均受试者工作特征曲线。
Br J Radiol. 2014 Aug;87(1040):20140016. doi: 10.1259/bjr.20140016. Epub 2014 Jun 2.
10
The receiver operating characteristic curve accurately assesses imbalanced datasets.受试者工作特征曲线能准确评估不均衡数据集。
Patterns (N Y). 2024 May 31;5(6):100994. doi: 10.1016/j.patter.2024.100994. eCollection 2024 Jun 14.

引用本文的文献

1
Development and Validation of a Machine Learning-Based Online Prognostic Model for Cervical Spondylosis Patients After Anterior Cervical Discectomy and Fusion: A Multicenter Study.基于机器学习的颈椎前路椎间盘切除融合术后颈椎病患者在线预后模型的开发与验证:一项多中心研究
JOR Spine. 2025 Jul 28;8(3):e70090. doi: 10.1002/jsp2.70090. eCollection 2025 Sep.
2
Predictive model of malignancy probability in pulmonary nodules based on multicenter data.基于多中心数据的肺结节恶性概率预测模型
Front Oncol. 2025 May 28;15:1588147. doi: 10.3389/fonc.2025.1588147. eCollection 2025.
3
Development of a machine learning-based predictive model for maxillary sinus cysts and exploration of clustering patterns.

本文引用的文献

1
Predicting species distribution: offering more than simple habitat models.预测物种分布:提供的不仅仅是简单的栖息地模型。
Ecol Lett. 2005 Sep;8(9):993-1009. doi: 10.1111/j.1461-0248.2005.00792.x. Epub 2005 Jun 23.
2
On the selection of thresholds for predicting species occurrence with presence-only data.关于使用仅存在数据预测物种出现的阈值选择
Ecol Evol. 2015 Dec 29;6(1):337-48. doi: 10.1002/ece3.1878. eCollection 2016 Jan.
3
The precision-recall plot is more informative than the ROC plot when evaluating binary classifiers on imbalanced datasets.
基于机器学习的上颌窦囊肿预测模型的开发及聚类模式探索。
Head Face Med. 2025 Mar 12;21(1):17. doi: 10.1186/s13005-025-00492-y.
4
A Risk Warning Model for Anemia Based on Facial Visible Light Reflectance Spectroscopy: Cross-Sectional Study.基于面部可见光反射光谱的贫血风险预警模型:横断面研究
JMIR Med Inform. 2025 Feb 14;13:e64204. doi: 10.2196/64204.
5
Evaluation of inflammatory-thrombosis panel as a diagnostic tool for vascular Behçet's disease.评估炎症-血栓形成指标作为血管性白塞病的诊断工具
Clin Rheumatol. 2025 Mar;44(3):1279-1291. doi: 10.1007/s10067-025-07301-6. Epub 2025 Jan 31.
6
Preoperative prediction of the selection of the NOTES approach for patients with symptomatic simple renal cysts via an interpretable machine learning model: a retrospective study of 264 patients.通过可解释机器学习模型对有症状的单纯性肾囊肿患者NOTES手术入路选择的术前预测:一项对264例患者的回顾性研究
Langenbecks Arch Surg. 2025 Jan 4;410(1):22. doi: 10.1007/s00423-024-03586-4.
7
Analyzing risk factors and constructing a predictive model for superficial esophageal carcinoma with submucosal infiltration exceeding 200 micrometers.分析黏膜下浸润超过 200 微米的表浅食管癌的危险因素并构建预测模型。
BMC Gastroenterol. 2024 Oct 6;24(1):350. doi: 10.1186/s12876-024-03442-1.
8
Early Warning Models Using Machine Learning to Predict Sepsis-Associated Chronic Critical Illness: A Study Based on the Medical Information Mart for Intensive Care Database.使用机器学习预测脓毒症相关慢性危重病的早期预警模型:一项基于重症监护医学信息数据库的研究
Cureus. 2024 Aug 18;16(8):e67121. doi: 10.7759/cureus.67121. eCollection 2024 Aug.
9
Machine learning-based model for worsening heart failure risk in Chinese chronic heart failure patients.基于机器学习的中国慢性心力衰竭患者心力衰竭恶化风险模型
ESC Heart Fail. 2025 Feb;12(1):211-228. doi: 10.1002/ehf2.15066. Epub 2024 Sep 7.
10
A comparative benchmarking and evaluation framework for heterogeneous network-based drug repositioning methods.基于异构网络的药物重定位方法的比较基准和评估框架。
Brief Bioinform. 2024 Mar 27;25(3). doi: 10.1093/bib/bbae172.
在不平衡数据集上评估二元分类器时,精确率-召回率曲线比ROC曲线更具信息性。
PLoS One. 2015 Mar 4;10(3):e0118432. doi: 10.1371/journal.pone.0118432. eCollection 2015.
4
Inference from presence-only data; the ongoing controversy.仅存在数据的推断:持续的争议。
Ecography. 2013 Aug 1;36(8):864-867. doi: 10.1111/j.1600-0587.2013.00321.x.
5
Unachievable Region in Precision-Recall Space and Its Effect on Empirical Evaluation.精确率-召回率空间中的不可达区域及其对实证评估的影响。
Proc Int Conf Mach Learn. 2012 Dec 1;2012:349.
6
On estimating probability of presence from use-availability or presence-background data.从使用可得性或存在背景数据估计存在概率。
Ecology. 2013 Jun;94(6):1409-19. doi: 10.1890/12-1520.1.
7
POC plots: calibrating species distribution models with presence-only data.POC 图:使用仅有存在数据校准物种分布模型。
Ecology. 2010 Aug;91(8):2476-84. doi: 10.1890/09-0760.1.
8
Presence-only data and the em algorithm.仅存在数据与期望最大化算法
Biometrics. 2009 Jun;65(2):554-63. doi: 10.1111/j.1541-0420.2008.01116.x.
9
Modeled regional climate change and California endemic oak ranges.模拟的区域气候变化与加利福尼亚州特有的橡树分布范围。
Proc Natl Acad Sci U S A. 2005 Nov 8;102(45):16281-6. doi: 10.1073/pnas.0501427102. Epub 2005 Oct 31.