• 文献检索
  • 文档翻译
  • 深度研究
  • 学术资讯
  • Suppr Zotero 插件Zotero 插件
  • 邀请有礼
  • 套餐&价格
  • 历史记录
应用&插件
Suppr Zotero 插件Zotero 插件浏览器插件Mac 客户端Windows 客户端微信小程序
定价
高级版会员购买积分包购买API积分包
服务
文献检索文档翻译深度研究API 文档MCP 服务
关于我们
关于 Suppr公司介绍联系我们用户协议隐私条款
关注我们

Suppr 超能文献

核心技术专利:CN118964589B侵权必究
粤ICP备2023148730 号-1Suppr @ 2026

文献检索

告别复杂PubMed语法,用中文像聊天一样搜索,搜遍4000万医学文献。AI智能推荐,让科研检索更轻松。

立即免费搜索

文件翻译

保留排版,准确专业,支持PDF/Word/PPT等文件格式,支持 12+语言互译。

免费翻译文档

深度研究

AI帮你快速写综述,25分钟生成高质量综述,智能提取关键信息,辅助科研写作。

立即免费体验

利用背包式 LiDAR 和 CropQuant-3D 进行大规模田间表型分析,测量小麦结构变异。

Large-scale field phenotyping using backpack LiDAR and CropQuant-3D to measure structural variation in wheat.

机构信息

State Key Laboratory of Crop Genetics and Germplasm Enhancement, College of Engineering, College of Agriculture, Plant Phenomics Research Center, Academy for Advanced Interdisciplinary Studies, Jiangsu Collaborative Innovation Center for Modern Crop Production Co-sponsored by Province and Ministry, Nanjing Agricultural University, Nanjing 210095, China.

Zhenjiang Institute of Agricultural Science in Hill Area of Jiangsu Province, Jurong 212400, China.

出版信息

Plant Physiol. 2021 Oct 5;187(2):716-738. doi: 10.1093/plphys/kiab324.

DOI:10.1093/plphys/kiab324
PMID:34608970
原文链接:https://pmc.ncbi.nlm.nih.gov/articles/PMC8491082/
Abstract

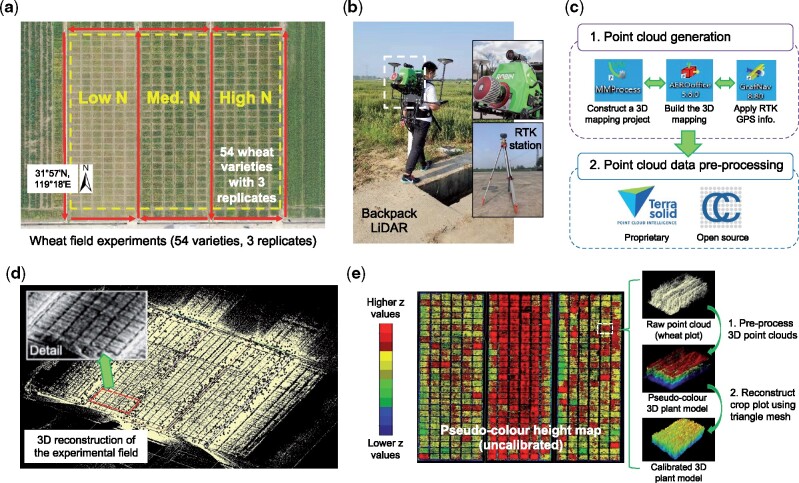
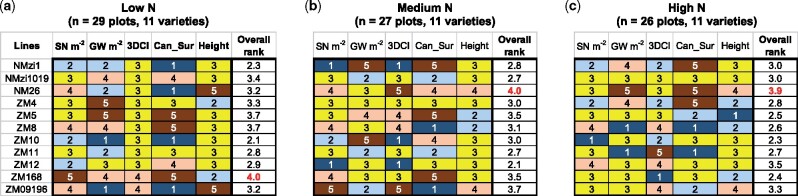
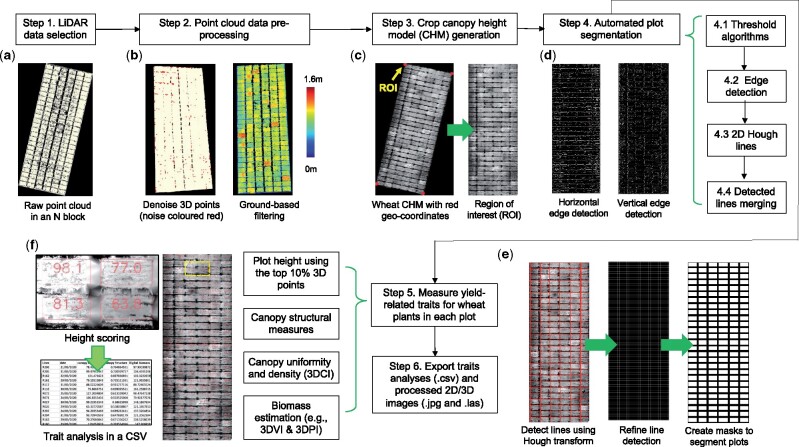
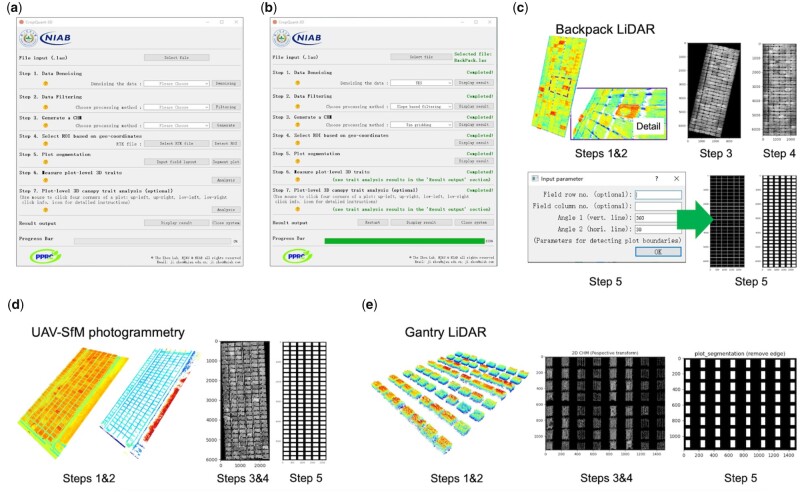
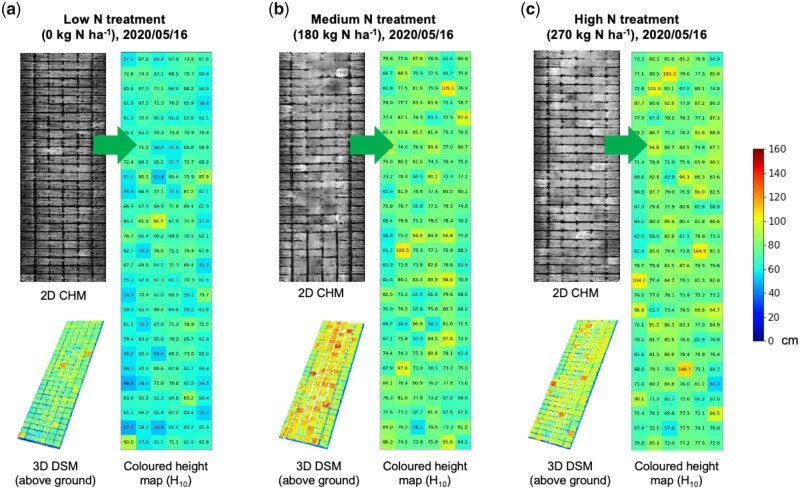
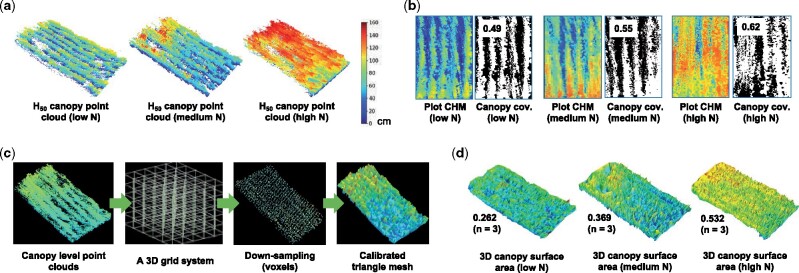
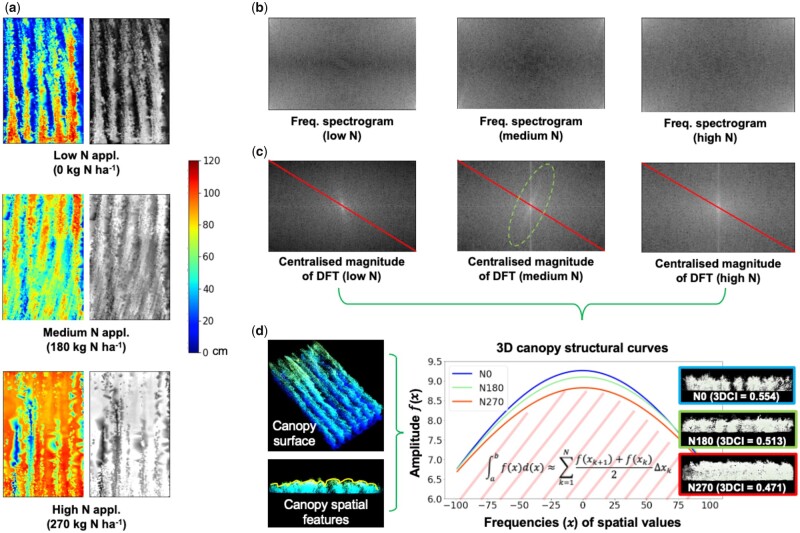
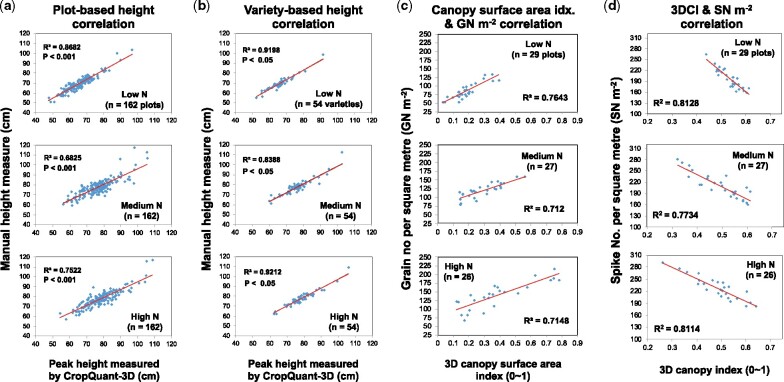
Plant phenomics bridges the gap between traits of agricultural importance and genomic information. Limitations of current field-based phenotyping solutions include mobility, affordability, throughput, accuracy, scalability, and the ability to analyze big data collected. Here, we present a large-scale phenotyping solution that combines a commercial backpack Light Detection and Ranging (LiDAR) device and our analytic software, CropQuant-3D, which have been applied jointly to phenotype wheat (Triticum aestivum) and associated 3D trait analysis. The use of LiDAR can acquire millions of 3D points to represent spatial features of crops, and CropQuant-3D can extract meaningful traits from large, complex point clouds. In a case study examining the response of wheat varieties to three different levels of nitrogen fertilization in field experiments, the combined solution differentiated significant genotype and treatment effects on crop growth and structural variation in the canopy, with strong correlations with manual measurements. Hence, we demonstrate that this system could consistently perform 3D trait analysis at a larger scale and more quickly than heretofore possible and addresses challenges in mobility, throughput, and scalability. To ensure our work could reach non-expert users, we developed an open-source graphical user interface for CropQuant-3D. We, therefore, believe that the combined system is easy-to-use and could be used as a reliable research tool in multi-location phenotyping for both crop research and breeding. Furthermore, together with the fast maturity of LiDAR technologies, the system has the potential for further development in accuracy and affordability, contributing to the resolution of the phenotyping bottleneck and exploiting available genomic resources more effectively.

摘要

植物表型组学弥合了农业重要性状与基因组信息之间的差距。当前基于田间的表型分析解决方案的局限性包括移动性、经济性、通量、准确性、可扩展性以及分析所收集大数据的能力。在这里,我们提出了一种大规模的表型分析解决方案,它结合了商用背包式光探测和测距(LiDAR)设备和我们的分析软件 CropQuant-3D,该软件已联合用于对小麦(Triticum aestivum)和相关的 3D 性状进行表型分析。LiDAR 的使用可以获取数百万个 3D 点来表示作物的空间特征,而 CropQuant-3D 可以从大型、复杂的点云中提取有意义的特征。在一项研究中,我们检查了小麦品种对田间试验中三种不同氮施肥水平的反应,该联合解决方案可以区分作物生长和冠层结构变化的显著基因型和处理效应,与手动测量具有很强的相关性。因此,我们证明该系统可以比以往更快速、更一致地在更大规模上进行 3D 性状分析,并且解决了移动性、通量和可扩展性方面的挑战。为了确保我们的工作能够覆盖非专业用户,我们为 CropQuant-3D 开发了一个开源图形用户界面。因此,我们认为该联合系统易于使用,可以作为作物研究和育种中多地点表型分析的可靠研究工具。此外,随着 LiDAR 技术的快速成熟,该系统在准确性和经济性方面具有进一步发展的潜力,有助于解决表型瓶颈问题,并更有效地利用现有基因组资源。

https://cdn.ncbi.nlm.nih.gov/pmc/blobs/f636/8491082/4e31fdb3633b/kiab324f9.jpg
https://cdn.ncbi.nlm.nih.gov/pmc/blobs/f636/8491082/7664964698ae/kiab324f1.jpg
https://cdn.ncbi.nlm.nih.gov/pmc/blobs/f636/8491082/d39e707d4603/kiab324f2.jpg
https://cdn.ncbi.nlm.nih.gov/pmc/blobs/f636/8491082/328322248d84/kiab324f3.jpg
https://cdn.ncbi.nlm.nih.gov/pmc/blobs/f636/8491082/d7100049aa54/kiab324f4.jpg
https://cdn.ncbi.nlm.nih.gov/pmc/blobs/f636/8491082/b559f3757924/kiab324f5.jpg
https://cdn.ncbi.nlm.nih.gov/pmc/blobs/f636/8491082/7aa4efb857de/kiab324f6.jpg
https://cdn.ncbi.nlm.nih.gov/pmc/blobs/f636/8491082/e866fb2f4f71/kiab324f7.jpg
https://cdn.ncbi.nlm.nih.gov/pmc/blobs/f636/8491082/e724479645e4/kiab324f8.jpg
https://cdn.ncbi.nlm.nih.gov/pmc/blobs/f636/8491082/4e31fdb3633b/kiab324f9.jpg

相似文献

1
Large-scale field phenotyping using backpack LiDAR and CropQuant-3D to measure structural variation in wheat.利用背包式 LiDAR 和 CropQuant-3D 进行大规模田间表型分析,测量小麦结构变异。
Plant Physiol. 2021 Oct 5;187(2):716-738. doi: 10.1093/plphys/kiab324.
2
CropQuant-Air: an AI-powered system to enable phenotypic analysis of yield- and performance-related traits using wheat canopy imagery collected by low-cost drones.CropQuant-Air:一种人工智能驱动的系统,可利用低成本无人机收集的小麦冠层图像,对与产量和性能相关的性状进行表型分析。
Front Plant Sci. 2023 Jun 19;14:1219983. doi: 10.3389/fpls.2023.1219983. eCollection 2023.
3
Crop 3D-a LiDAR based platform for 3D high-throughput crop phenotyping.作物 3D - 基于 LiDAR 的高通量作物表型 3D 平台。
Sci China Life Sci. 2018 Mar;61(3):328-339. doi: 10.1007/s11427-017-9056-0. Epub 2017 Dec 6.
4
Wheat Height Estimation Using LiDAR in Comparison to Ultrasonic Sensor and UAS.基于激光雷达与超声传感器和无人机系统比较的小麦高度估测。
Sensors (Basel). 2018 Nov 2;18(11):3731. doi: 10.3390/s18113731.
5
Temporal and Spectral Optimization of Vegetation Indices for Estimating Grain Nitrogen Uptake and Late-Seasonal Nitrogen Traits in Wheat.基于时间和光谱优化植被指数估算小麦籽粒氮吸收和后期氮素特性
Sensors (Basel). 2019 Oct 25;19(21):4640. doi: 10.3390/s19214640.
6
LiDARPheno - A Low-Cost LiDAR-Based 3D Scanning System for Leaf Morphological Trait Extraction.LiDARPheno - 一种用于叶片形态特征提取的低成本基于激光雷达的三维扫描系统。
Front Plant Sci. 2019 Feb 13;10:147. doi: 10.3389/fpls.2019.00147. eCollection 2019.
7
CropSight: a scalable and open-source information management system for distributed plant phenotyping and IoT-based crop management.作物视觉:一种用于分布式植物表型分析和基于物联网的作物管理的可扩展开源信息管理系统。
Gigascience. 2019 Mar 1;8(3). doi: 10.1093/gigascience/giz009.
8
In-field High Throughput Phenotyping and Cotton Plant Growth Analysis Using LiDAR.利用激光雷达进行田间高通量表型分析及棉花植株生长分析
Front Plant Sci. 2018 Jan 22;9:16. doi: 10.3389/fpls.2018.00016. eCollection 2018.
9
Functional mapping of N deficiency-induced response in wheat yield-component traits by implementing high-throughput phenotyping.通过实施高通量表型分析,对小麦产量性状中氮缺乏诱导响应进行功能定位。
Plant J. 2019 Mar;97(6):1105-1119. doi: 10.1111/tpj.14186. Epub 2019 Jan 30.
10
Estimating Biomass and Canopy Height With LiDAR for Field Crop Breeding.利用激光雷达估算大田作物育种的生物量和冠层高度
Front Plant Sci. 2019 Sep 26;10:1145. doi: 10.3389/fpls.2019.01145. eCollection 2019.

引用本文的文献

1
GSP-AI: An AI-Powered Platform for Identifying Key Growth Stages and the Vegetative-to-Reproductive Transition in Wheat Using Trilateral Drone Imagery and Meteorological Data.GSP-AI:一个利用三边无人机图像和气象数据识别小麦关键生长阶段及营养生长向生殖生长转变的人工智能平台。
Plant Phenomics. 2024 Oct 9;6:0255. doi: 10.34133/plantphenomics.0255. eCollection 2024.
2
A Comprehensive Review of LiDAR Applications in Crop Management for Precision Agriculture.激光雷达在精准农业作物管理中的应用综述
Sensors (Basel). 2024 Aug 21;24(16):5409. doi: 10.3390/s24165409.
3
3D Morphological Feature Quantification and Analysis of Corn Leaves.

本文引用的文献

1
Ground-Based LiDAR Improves Phenotypic Repeatability of Above-Ground Biomass and Crop Growth Rate in Wheat.地基激光雷达提高了小麦地上生物量和作物生长速率的表型重复性。
Plant Phenomics. 2020 May 26;2020:8329798. doi: 10.34133/2020/8329798. eCollection 2020.
2
Plant Phenotyping: Past, Present, and Future.植物表型分析:过去、现在与未来。
Plant Phenomics. 2019 Mar 26;2019:7507131. doi: 10.34133/2019/7507131. eCollection 2019.
3
SeedGerm: a cost-effective phenotyping platform for automated seed imaging and machine-learning based phenotypic analysis of crop seed germination.
玉米叶片的三维形态特征量化与分析
Plant Phenomics. 2024 Aug 6;6:0225. doi: 10.34133/plantphenomics.0225. eCollection 2024.
4
EasyDAM_V4: Guided-GAN-based cross-species data labeling for fruit detection with significant shape difference.EasyDAM_V4:基于引导生成对抗网络的跨物种水果检测数据标注,用于形状差异显著的水果检测。
Hortic Res. 2024 Jan 10;11(3):uhae007. doi: 10.1093/hr/uhae007. eCollection 2024 Mar.
5
Crop growth dynamics: Fast automatic analysis of LiDAR images in field-plot experiments by specialized software ALFA.作物生长动态:通过专用软件 ALFA 快速自动分析田间试验中的 LiDAR 图像。
PLoS One. 2024 Jan 18;19(1):e0297153. doi: 10.1371/journal.pone.0297153. eCollection 2024.
6
The Dissection of Nitrogen Response Traits Using Drone Phenotyping and Dynamic Phenotypic Analysis to Explore N Responsiveness and Associated Genetic Loci in Wheat.利用无人机表型分析和动态表型分析剖析氮响应性状,以探究小麦的氮响应性及相关基因位点
Plant Phenomics. 2023 Dec 22;5:0128. doi: 10.34133/plantphenomics.0128. eCollection 2023.
7
Forward Collision Warning Strategy Based on Millimeter-Wave Radar and Visual Fusion.基于毫米波雷达与视觉融合的前碰撞预警策略
Sensors (Basel). 2023 Nov 21;23(23):9295. doi: 10.3390/s23239295.
8
Panicle-Cloud: An Open and AI-Powered Cloud Computing Platform for Quantifying Rice Panicles from Drone-Collected Imagery to Enable the Classification of Yield Production in Rice.圆锥花序云平台:一个开放且由人工智能驱动的云计算平台,用于从无人机采集的图像中量化水稻圆锥花序,以实现水稻产量分类。
Plant Phenomics. 2023 Oct 16;5:0105. doi: 10.34133/plantphenomics.0105. eCollection 2023.
9
CropQuant-Air: an AI-powered system to enable phenotypic analysis of yield- and performance-related traits using wheat canopy imagery collected by low-cost drones.CropQuant-Air:一种人工智能驱动的系统,可利用低成本无人机收集的小麦冠层图像,对与产量和性能相关的性状进行表型分析。
Front Plant Sci. 2023 Jun 19;14:1219983. doi: 10.3389/fpls.2023.1219983. eCollection 2023.
10
A Synthetic Review of Various Dimensions of Non-Destructive Plant Stress Phenotyping.非破坏性植物胁迫表型分析各维度的综合综述
Plants (Basel). 2023 Apr 18;12(8):1698. doi: 10.3390/plants12081698.
SeedGerm:一个用于作物种子萌发的自动种子成像和基于机器学习的表型分析的经济高效型表型分析平台。
New Phytol. 2020 Oct;228(2):778-793. doi: 10.1111/nph.16736. Epub 2020 Jul 17.
4
Comparison of ground cover estimates from experiment plots in cotton, sorghum and sugarcane based on images and ortho-mosaics captured by UAV.基于无人机拍摄的图像和正射镶嵌图对棉花、高粱和甘蔗试验地的地面覆盖估计进行比较。
Funct Plant Biol. 2016 Feb;44(1):169-183. doi: 10.1071/FP16123.
5
The ETH field phenotyping platform FIP: a cable-suspended multi-sensor system.瑞士联邦理工学院田间表型分析平台FIP:一种电缆悬挂式多传感器系统。
Funct Plant Biol. 2016 Feb;44(1):154-168. doi: 10.1071/FP16165.
6
Field Scanalyzer: An automated robotic field phenotyping platform for detailed crop monitoring.田间分析仪:一种用于详细作物监测的自动化机器人田间表型分析平台。
Funct Plant Biol. 2016 Feb;44(1):143-153. doi: 10.1071/FP16163.
7
Improving nitrogen use efficiency in plants: effective phenotyping in conjunction with agronomic and genetic approaches.提高植物氮素利用效率:结合农艺和遗传方法进行有效的表型分析。
Funct Plant Biol. 2018 May;45(6):606-619. doi: 10.1071/FP17266.
8
Comprehensive 3D phenotyping reveals continuous morphological variation across genetically diverse sorghum inflorescences.综合 3D 表型分析揭示了遗传多样性高粱花序的连续形态变异。
New Phytol. 2020 Jun;226(6):1873-1885. doi: 10.1111/nph.16533. Epub 2020 Apr 16.
9
SciPy 1.0: fundamental algorithms for scientific computing in Python.SciPy 1.0:Python 中的科学计算基础算法。
Nat Methods. 2020 Mar;17(3):261-272. doi: 10.1038/s41592-019-0686-2. Epub 2020 Feb 3.
10
Crop Phenomics and High-Throughput Phenotyping: Past Decades, Current Challenges, and Future Perspectives.作物表型组学和高通量表型分析:过去几十年、当前挑战和未来展望。
Mol Plant. 2020 Feb 3;13(2):187-214. doi: 10.1016/j.molp.2020.01.008. Epub 2020 Jan 22.