• 文献检索
  • 文档翻译
  • 深度研究
  • 学术资讯
  • Suppr Zotero 插件Zotero 插件
  • 邀请有礼
  • 套餐&价格
  • 历史记录
应用&插件
Suppr Zotero 插件Zotero 插件浏览器插件Mac 客户端Windows 客户端微信小程序
定价
高级版会员购买积分包购买API积分包
服务
文献检索文档翻译深度研究API 文档MCP 服务
关于我们
关于 Suppr公司介绍联系我们用户协议隐私条款
关注我们

Suppr 超能文献

核心技术专利:CN118964589B侵权必究
粤ICP备2023148730 号-1Suppr @ 2026

文献检索

告别复杂PubMed语法,用中文像聊天一样搜索,搜遍4000万医学文献。AI智能推荐,让科研检索更轻松。

立即免费搜索

文件翻译

保留排版,准确专业,支持PDF/Word/PPT等文件格式,支持 12+语言互译。

免费翻译文档

深度研究

AI帮你快速写综述,25分钟生成高质量综述,智能提取关键信息,辅助科研写作。

立即免费体验

不同统计方法估计风险差的置信区间及其对抗生素非劣效临床试验结论的影响。

Confidence interval of risk difference by different statistical methods and its impact on the study conclusion in antibiotic non-inferiority trials.

机构信息

Division of Infectious Diseases, Queen's University, Kingston, ON, Canada.

Health Research Methodology Program, McMaster University, Hamilton, ON, Canada.

出版信息

Trials. 2021 Oct 16;22(1):708. doi: 10.1186/s13063-021-05686-8.

DOI:10.1186/s13063-021-05686-8
PMID:34656155
原文链接:https://pmc.ncbi.nlm.nih.gov/articles/PMC8520289/
Abstract

BACKGROUND

Numerous statistical methods can be used to calculate the confidence interval (CI) of risk differences. There is consensus in previous literature that the Wald method should be discouraged. We compared five statistical methods for estimating the CI of risk difference in terms of CI width and study conclusion in antibiotic non-inferiority trials.

METHODS

In a secondary analysis of a systematic review, we included non-inferiority trials that compared different antibiotic regimens, reported risk differences for the primary outcome, and described the number of successes and/or failures as well as patients in each arm. For each study, we re-calculated the risk difference CI using the Wald, Agresti-Caffo, Newcombe, Miettinen-Nurminen, and skewness-corrected asymptotic score (SCAS) methods. The CIs by different statistical methods were compared in terms of CI width and conclusion on non-inferiority. A wider CI was considered to be more conservative.

RESULTS

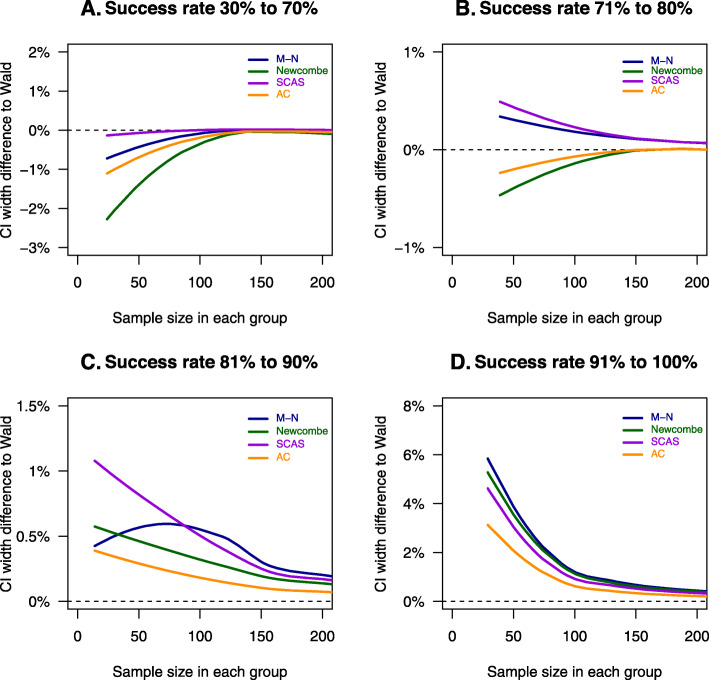
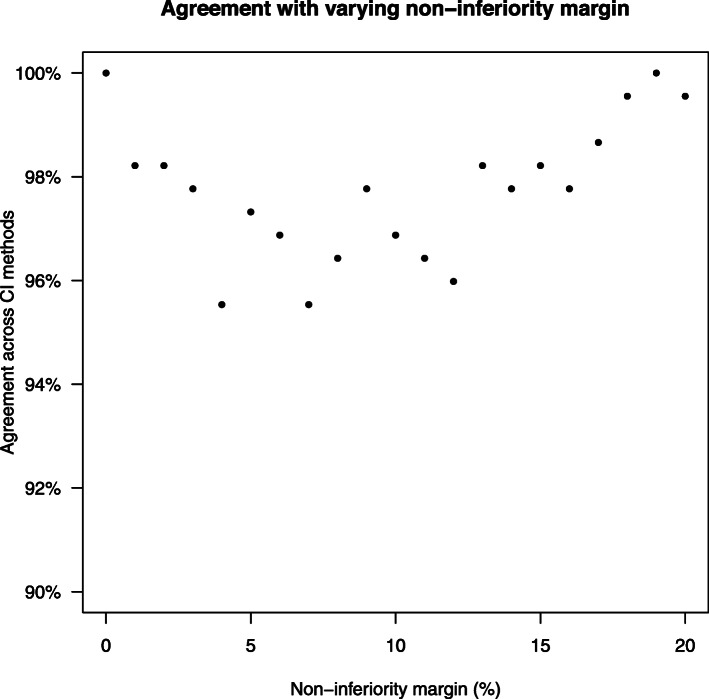
The analysis included 224 comparisons from 213 studies. The statistical method used to calculate CI was not reported in 134 (59.8%) cases. The median (interquartile range IQR) for CI width by Wald, Agresti-Caffo, Newcombe, Miettinen-Nurminen, and SCAS methods was 13.0% (10.8%, 17.4%), 13.3% (10.9%, 18.5%), 13.6% (11.1%, 18.9%), 13.6% (11.1% and 19.0%), and 13.4% (11.1%, 18.9%), respectively. In 216 comparisons that reported a non-inferiority margin, the conclusion on non-inferiority was the same across the five statistical methods in 211 (97.7%) cases. The differences in CI width were more in trials with a sample size of 100 or less in each group and treatment success rate above 90%. Of the 18 trials in this subgroup with a specified non-inferiority margin, non-inferiority was shown in 17 (94.4%), 16 (88.9%), 14 (77.8%), 14 (77.8%), and 15 (83.3%) cases based on CI by Wald, Agresti-Caffo, Newcombe, Miettinen-Nurminen, and SCAS methods, respectively.

CONCLUSIONS

The statistical method used to calculate CI was not reported in the majority of antibiotic non-inferiority trials. Different statistical methods for CI resulted in different conclusions on non-inferiority in 2.3% cases. The differences in CI widths were highest in trials with a sample size of 100 or less in each group and a treatment success rate above 90%.

TRIAL REGISTRATION

PROSPERO CRD42020165040 . April 28, 2020.

摘要

背景

有许多统计学方法可用于计算风险差异的置信区间 (CI)。先前的文献中有共识认为应避免 Wald 法。我们比较了五种在抗生素非劣效性试验中估计风险差异 CI 的统计方法,以 CI 宽度和研究结论为指标。

方法

在一项系统评价的二次分析中,我们纳入了比较不同抗生素方案、报告主要结局风险差异且描述了每组成功和/或失败例数及患者数的非劣效性试验。对于每个研究,我们使用 Wald、Agresti-Caffo、Newcombe、Miettinen-Nurminen 和偏度校正渐近得分 (SCAS) 方法重新计算风险差异 CI。不同统计方法的 CI 以 CI 宽度和非劣效性结论进行比较。CI 越宽则被认为越保守。

结果

分析纳入了来自 213 项研究的 224 项比较。134 项(59.8%)研究未报告计算 CI 所使用的统计学方法。Wald、Agresti-Caffo、Newcombe、Miettinen-Nurminen 和 SCAS 方法的 CI 宽度中位数(四分位距 IQR)分别为 13.0%(10.8%,17.4%)、13.3%(10.9%,18.5%)、13.6%(11.1%,18.9%)、13.6%(11.1%和 19.0%)和 13.4%(11.1%,18.9%)。在 216 项报告了非劣效性边界的比较中,5 种统计方法在 211 项(97.7%)研究中得出了相同的非劣效性结论。在每组样本量为 100 或更少和治疗成功率高于 90%的试验中,CI 宽度的差异更大。在这个亚组的 18 项指定了非劣效性边界的试验中,基于 Wald、Agresti-Caffo、Newcombe、Miettinen-Nurminen 和 SCAS 方法的 CI,非劣效性在 17 项(94.4%)、16 项(88.9%)、14 项(77.8%)、14 项(77.8%)和 15 项(83.3%)中得到了证实。

结论

在大多数抗生素非劣效性试验中,未报告计算 CI 所使用的统计学方法。在 2.3%的情况下,不同的 CI 统计方法得出了不同的非劣效性结论。在每组样本量为 100 或更少和治疗成功率高于 90%的试验中,CI 宽度的差异最大。

试验注册

PROSPERO CRD42020165040。2020 年 4 月 28 日。

https://cdn.ncbi.nlm.nih.gov/pmc/blobs/1f8c/8520289/0278f7e58203/13063_2021_5686_Fig4_HTML.jpg
https://cdn.ncbi.nlm.nih.gov/pmc/blobs/1f8c/8520289/85d45898f681/13063_2021_5686_Fig1_HTML.jpg
https://cdn.ncbi.nlm.nih.gov/pmc/blobs/1f8c/8520289/0e5088bc6ddb/13063_2021_5686_Fig2_HTML.jpg
https://cdn.ncbi.nlm.nih.gov/pmc/blobs/1f8c/8520289/934daae9e12e/13063_2021_5686_Fig3_HTML.jpg
https://cdn.ncbi.nlm.nih.gov/pmc/blobs/1f8c/8520289/0278f7e58203/13063_2021_5686_Fig4_HTML.jpg

相似文献

1
Confidence interval of risk difference by different statistical methods and its impact on the study conclusion in antibiotic non-inferiority trials.不同统计方法估计风险差的置信区间及其对抗生素非劣效临床试验结论的影响。
Trials. 2021 Oct 16;22(1):708. doi: 10.1186/s13063-021-05686-8.
2
Intention-to-treat analysis may be more conservative than per protocol analysis in antibiotic non-inferiority trials: a systematic review.意向治疗分析可能比方案分析更保守:一项系统评价。
BMC Med Res Methodol. 2021 Apr 19;21(1):75. doi: 10.1186/s12874-021-01260-7.
3
Multiple imputation analysis of Miettinen-Nurminen interval for difference in proportions.对比例差异的米耶蒂宁-努尔米宁区间进行多重填补分析。
Pharm Stat. 2022 Jan;21(1):196-208. doi: 10.1002/pst.2162. Epub 2021 Aug 13.
4
Impact of disinvestment from weekend allied health services across acute medical and surgical wards: 2 stepped-wedge cluster randomised controlled trials.削减急性内科和外科病房周末辅助医疗服务投入的影响:两项阶梯楔形整群随机对照试验
PLoS Med. 2017 Oct 31;14(10):e1002412. doi: 10.1371/journal.pmed.1002412. eCollection 2017 Oct.
5
Testing non-inferiority of a new treatment in three-arm clinical trials with binary endpoints.在具有二元终点的三臂临床试验中检验新治疗方法的非劣效性。
BMC Med Res Methodol. 2014 Dec 18;14:134. doi: 10.1186/1471-2288-14-134.
6
Design of non-inferiority randomized trials using the difference in restricted mean survival times.基于受限平均生存时间差值的非劣效性随机临床试验设计。
Clin Trials. 2018 Oct;15(5):499-508. doi: 10.1177/1740774518792259. Epub 2018 Aug 3.
7
Choosing and changing the analysis scale in non-inferiority trials with a binary outcome.选择和改变二分类结局非劣效试验中的分析尺度。
Clin Trials. 2022 Feb;19(1):14-21. doi: 10.1177/17407745211053790. Epub 2021 Oct 24.
8
Handling an uncertain control group event risk in non-inferiority trials: non-inferiority frontiers and the power-stabilising transformation.处理非劣效试验中不确定的对照组事件风险:非劣效前沿和稳定功效转换。
Trials. 2020 Feb 6;21(1):145. doi: 10.1186/s13063-020-4070-4.
9
Methodological standards in non-inferiority AIDS trials: moving from adherence to compliance.非劣效性艾滋病试验中的方法学标准:从坚持到依从性的转变
BMC Med Res Methodol. 2006 Sep 20;6:46. doi: 10.1186/1471-2288-6-46.
10
Design and analysis of non-inferiority mortality trials in oncology.肿瘤学中非劣效性死亡率试验的设计与分析
Stat Med. 2003 Jan 30;22(2):239-64. doi: 10.1002/sim.1400.

引用本文的文献

1
Defining non-inferiority margins in randomised controlled surgical trials: a protocol for a systematic review.随机对照手术试验中定义非劣效性边界:系统评价方案。
BMJ Open. 2024 Aug 24;14(8):e089587. doi: 10.1136/bmjopen-2024-089587.
2
Person-centered hospital discharge data: Essential existing infrastructure to enhance public health surveillance of maternal substance use disorders in the midst of a national maternal overdose crisis.以患者为中心的出院数据:在全国产妇药物过量危机中加强对产妇物质使用障碍进行公共卫生监测的基本现有基础设施。
Ann Epidemiol. 2024 Jun;94:64-71. doi: 10.1016/j.annepidem.2024.04.007. Epub 2024 Apr 26.

本文引用的文献

1
Methodological and Reporting Quality of Noninferiority Randomized Controlled Trials Comparing Antibiotic Therapies: A Systematic Review.比较抗生素治疗的非劣效随机对照试验的方法学和报告质量:系统评价。
Clin Infect Dis. 2021 Oct 5;73(7):e1696-e1705. doi: 10.1093/cid/ciaa1353.
2
Equal-tailed confidence intervals for comparison of rates.用于率比较的双侧置信区间。
Pharm Stat. 2017 Sep;16(5):334-348. doi: 10.1002/pst.1813. Epub 2017 Jun 22.
3
Confidence intervals for the difference between independent binomial proportions: comparison using a graphical approach and moving averages.
独立二项比例差异的置信区间:使用图形方法和移动平均线进行比较
Pharm Stat. 2014 Sep-Oct;13(5):294-308. doi: 10.1002/pst.1631. Epub 2014 Aug 27.
4
Reporting of noninferiority and equivalence randomized trials: extension of the CONSORT 2010 statement.非劣效性和等效性随机试验报告:CONSORT 2010 声明的扩展。
JAMA. 2012 Dec 26;308(24):2594-604. doi: 10.1001/jama.2012.87802.
5
Recommended confidence intervals for two independent binomial proportions.两个独立二项比例的推荐置信区间。
Stat Methods Med Res. 2015 Apr;24(2):224-54. doi: 10.1177/0962280211415469. Epub 2011 Oct 13.
6
Statistical methods in recent HIV noninferiority trials: reanalysis of 11 trials.近期 HIV 非劣效性试验中的统计学方法:11 项试验的再分析。
PLoS One. 2011;6(9):e22871. doi: 10.1371/journal.pone.0022871. Epub 2011 Sep 7.
7
Interval estimation for the difference between independent proportions: comparison of eleven methods.独立比例差异的区间估计:十一种方法的比较
Stat Med. 1998 Apr 30;17(8):873-90. doi: 10.1002/(sici)1097-0258(19980430)17:8<873::aid-sim779>3.0.co;2-i.
8
Comparative analysis of two rates.两种比率的比较分析。
Stat Med. 1985 Apr-Jun;4(2):213-26. doi: 10.1002/sim.4780040211.
9
Approximate interval estimation of the difference in binomial parameters: correction for skewness and extension to multiple tables.二项分布参数差异的近似区间估计:偏度校正及对多个表格的扩展
Biometrics. 1990 Sep;46(3):637-43.