• 文献检索
  • 文档翻译
  • 深度研究
  • 学术资讯
  • Suppr Zotero 插件Zotero 插件
  • 邀请有礼
  • 套餐&价格
  • 历史记录
应用&插件
Suppr Zotero 插件Zotero 插件浏览器插件Mac 客户端Windows 客户端微信小程序
定价
高级版会员购买积分包购买API积分包
服务
文献检索文档翻译深度研究API 文档MCP 服务
关于我们
关于 Suppr公司介绍联系我们用户协议隐私条款
关注我们

Suppr 超能文献

核心技术专利:CN118964589B侵权必究
粤ICP备2023148730 号-1Suppr @ 2026

文献检索

告别复杂PubMed语法,用中文像聊天一样搜索,搜遍4000万医学文献。AI智能推荐,让科研检索更轻松。

立即免费搜索

文件翻译

保留排版,准确专业,支持PDF/Word/PPT等文件格式,支持 12+语言互译。

免费翻译文档

深度研究

AI帮你快速写综述,25分钟生成高质量综述,智能提取关键信息,辅助科研写作。

立即免费体验

基于音频声谱图特征的共情评估系统

An Empathy Evaluation System Using Spectrogram Image Features of Audio.

机构信息

Department of Emotion Engineering, University of Sangmyung, Seoul 03016, Korea.

Department of Human Centered Artificial Intelligence, University of Sangmyung, Seoul 03016, Korea.

出版信息

Sensors (Basel). 2021 Oct 26;21(21):7111. doi: 10.3390/s21217111.

DOI:10.3390/s21217111
PMID:34770419
原文链接:https://pmc.ncbi.nlm.nih.gov/articles/PMC8587789/
Abstract

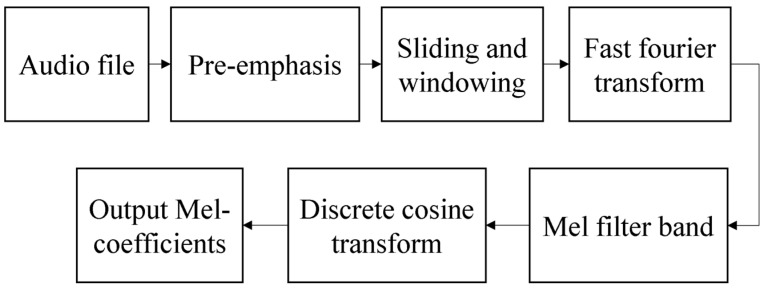
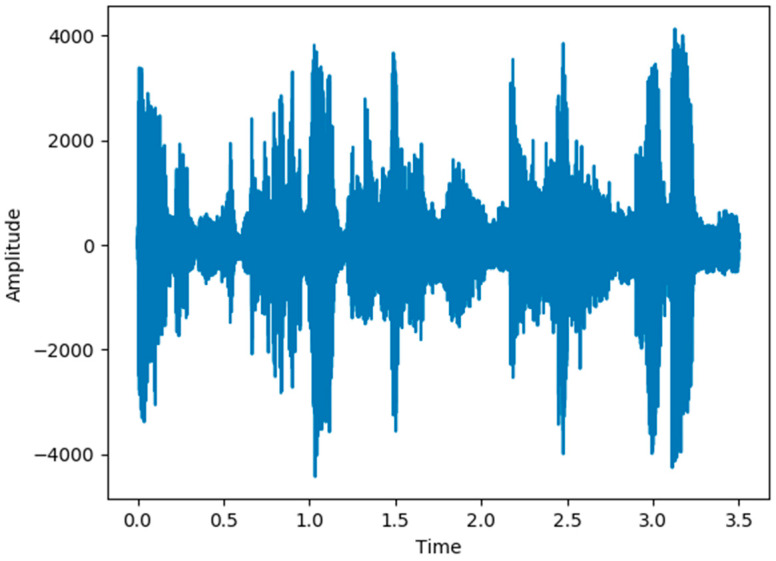
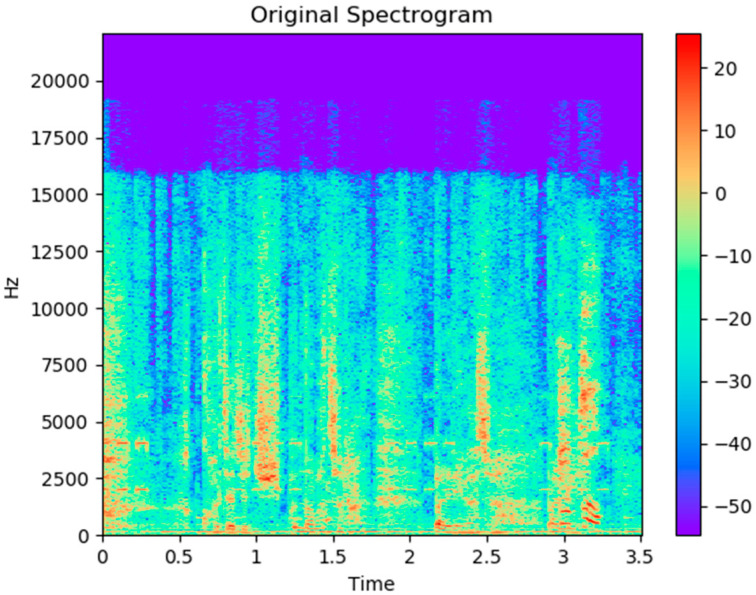
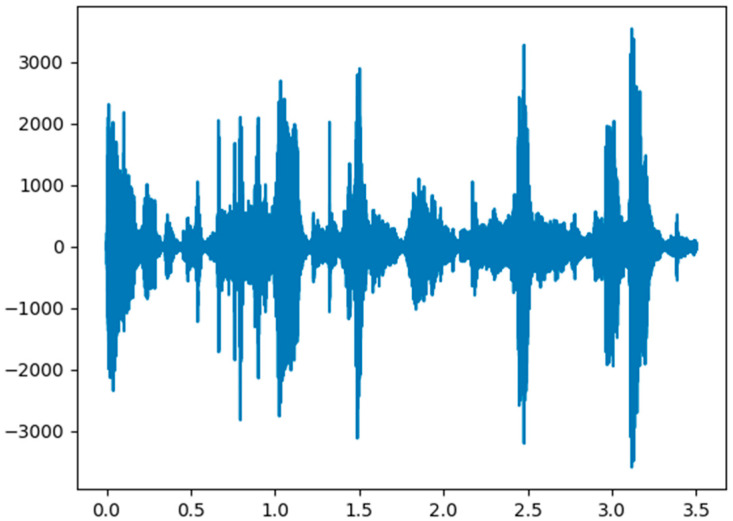
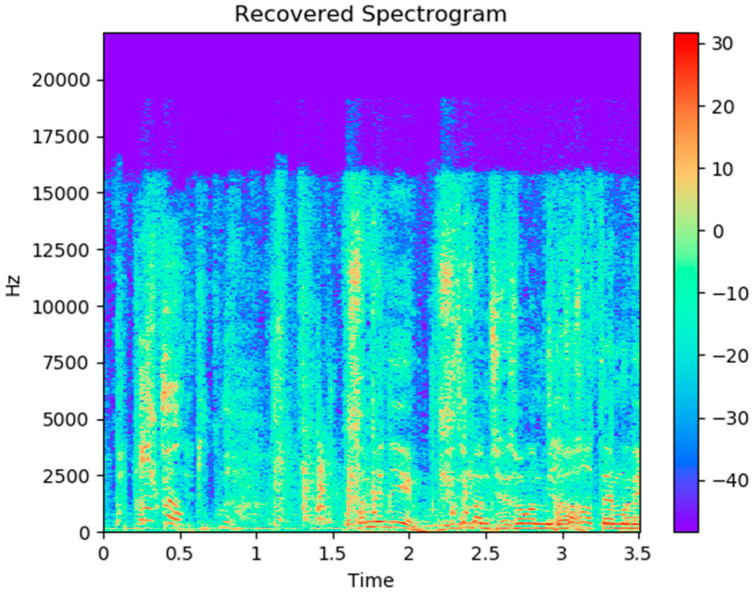
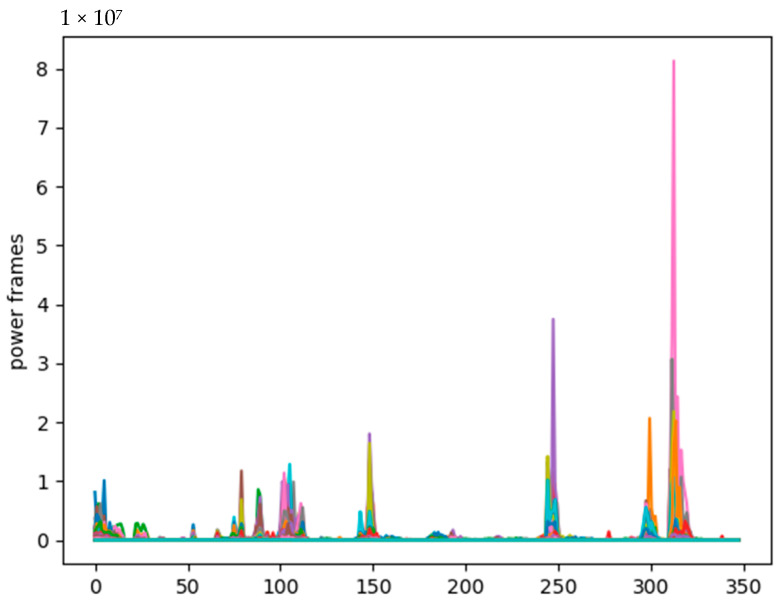
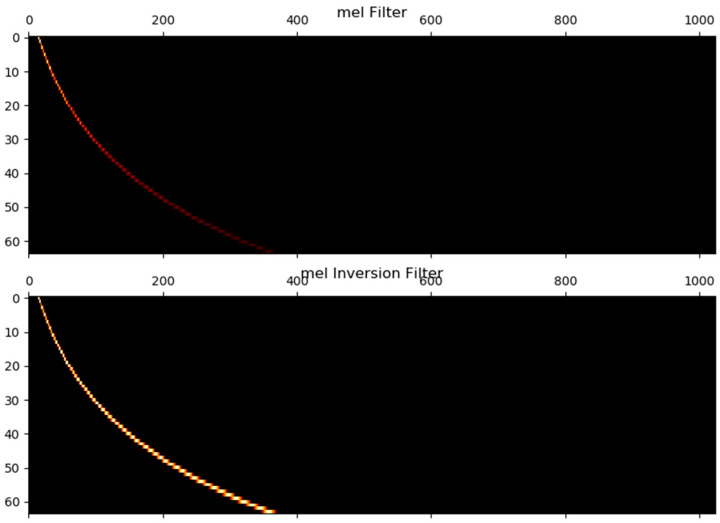
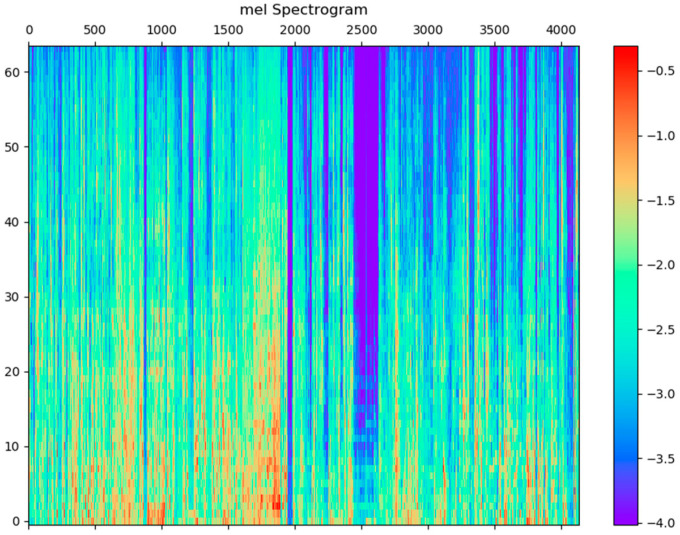
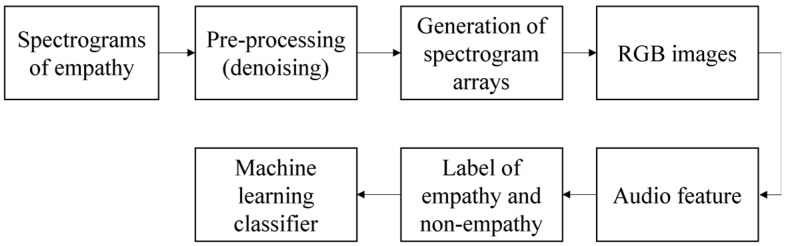
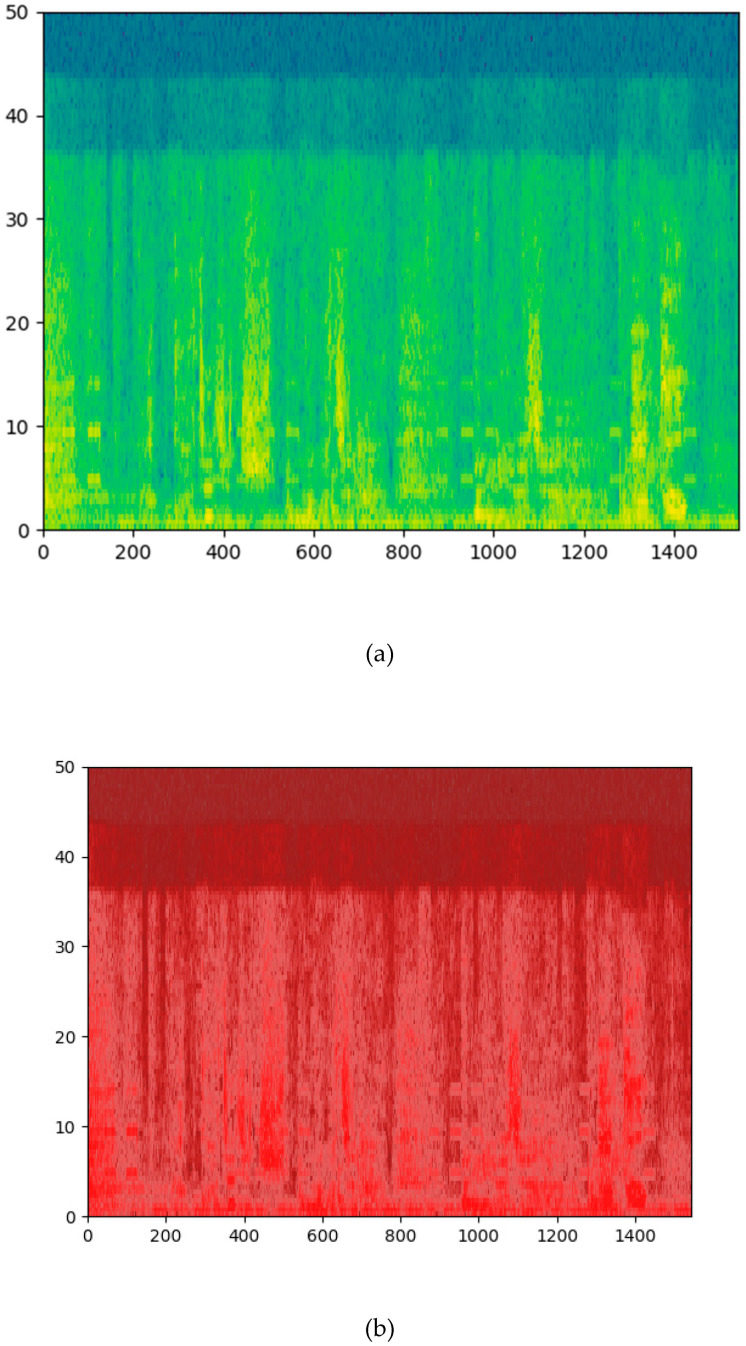
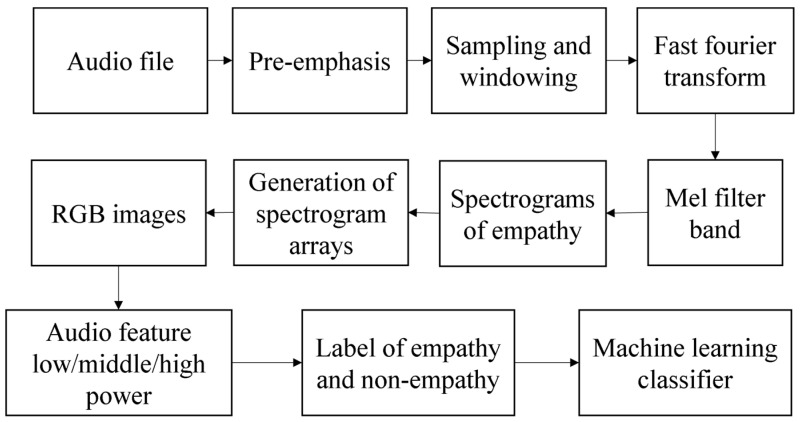
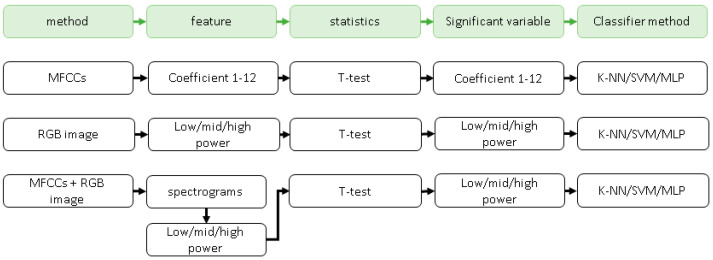
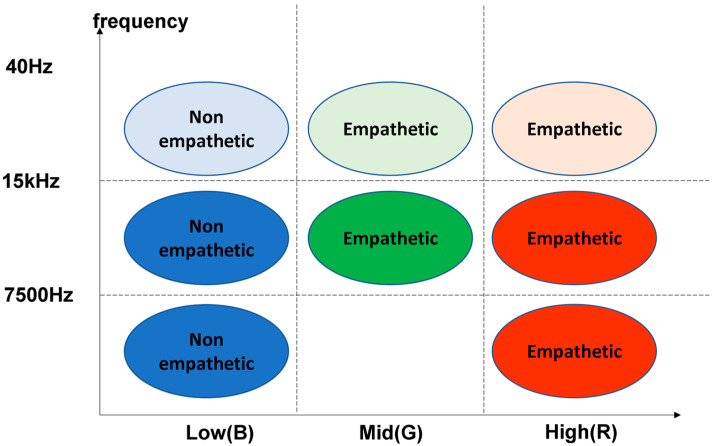
Watching videos online has become part of a relaxed lifestyle. The music in videos has a sensitive influence on human emotions, perception, and imaginations, which can make people feel relaxed or sad, and so on. Therefore, it is particularly important for people who make advertising videos to understand the relationship between the physical elements of music and empathy characteristics. The purpose of this paper is to analyze the music features in an advertising video and extract the music features that make people empathize. This paper combines both methods of the power spectrum of MFCC and image RGB analysis to find the audio feature vector. In spectral analysis, the eigenvectors obtained in the analysis process range from blue (low range) to green (medium range) to red (high range). The machine learning random forest classifier is used to classify the data obtained by machine learning, and the trained model is used to monitor the development of an advertisement empathy system in real time. The result is that the optimal model is obtained with the training accuracy result of 99.173% and a test accuracy of 86.171%, which can be deemed as correct by comparing the three models of audio feature value analysis. The contribution of this study can be summarized as follows: (1) the low-frequency and high-amplitude audio in the video is more likely to resonate than the high-frequency and high-amplitude audio; (2) it is found that frequency and audio amplitude are important attributes for describing waveforms by observing the characteristics of the machine learning classifier; (3) a new audio extraction method is proposed to induce human empathy. That is, the feature value extracted by the method of spectrogram image features of audio has the most ability to arouse human empathy.

摘要

在线观看视频已经成为一种轻松生活方式的一部分。视频中的音乐对人类的情感、感知和想象力有着敏感的影响,可以让人感到放松或悲伤等。因此,对于制作广告视频的人来说,了解音乐的物理元素与同理心特征之间的关系尤为重要。本文旨在分析广告视频中的音乐特征,并提取出能引起人们共鸣的音乐特征。本文结合 MFCC 功率谱和图像 RGB 分析两种方法来找到音频特征向量。在频谱分析中,分析过程中获得的特征向量从蓝色(低频)到绿色(中频)到红色(高频)逐渐变化。采用机器学习随机森林分类器对机器学习获得的数据进行分类,并使用训练好的模型实时监测广告共鸣系统的发展。结果表明,最优模型的训练准确率为 99.173%,测试准确率为 86.171%,通过比较三种音频特征值分析模型,可以认为结果是正确的。本研究的贡献可以总结如下:(1)视频中低频、高振幅的音频比高频、高振幅的音频更容易产生共鸣;(2)通过观察机器学习分类器的特征,可以发现频率和音频幅度是描述波形的重要属性;(3)提出了一种新的音频提取方法来引发人类共鸣。即通过音频的频谱图像特征提取的特征值最能引起人类共鸣。

https://cdn.ncbi.nlm.nih.gov/pmc/blobs/e3bc/8587789/b8e9ab10f880/sensors-21-07111-g016.jpg
https://cdn.ncbi.nlm.nih.gov/pmc/blobs/e3bc/8587789/343b0b5ad8ea/sensors-21-07111-g001.jpg
https://cdn.ncbi.nlm.nih.gov/pmc/blobs/e3bc/8587789/acca8cd4842b/sensors-21-07111-g002.jpg
https://cdn.ncbi.nlm.nih.gov/pmc/blobs/e3bc/8587789/e85139f7d588/sensors-21-07111-g003.jpg
https://cdn.ncbi.nlm.nih.gov/pmc/blobs/e3bc/8587789/c95604c1c314/sensors-21-07111-g004.jpg
https://cdn.ncbi.nlm.nih.gov/pmc/blobs/e3bc/8587789/fb63f53b93c1/sensors-21-07111-g005.jpg
https://cdn.ncbi.nlm.nih.gov/pmc/blobs/e3bc/8587789/79a146227e65/sensors-21-07111-g006.jpg
https://cdn.ncbi.nlm.nih.gov/pmc/blobs/e3bc/8587789/9205381f4d35/sensors-21-07111-g007.jpg
https://cdn.ncbi.nlm.nih.gov/pmc/blobs/e3bc/8587789/c1eda7d9b031/sensors-21-07111-g008.jpg
https://cdn.ncbi.nlm.nih.gov/pmc/blobs/e3bc/8587789/b561b4a21108/sensors-21-07111-g009.jpg
https://cdn.ncbi.nlm.nih.gov/pmc/blobs/e3bc/8587789/71e6bc06a76c/sensors-21-07111-g010.jpg
https://cdn.ncbi.nlm.nih.gov/pmc/blobs/e3bc/8587789/1c75332f3188/sensors-21-07111-g011.jpg
https://cdn.ncbi.nlm.nih.gov/pmc/blobs/e3bc/8587789/d870ddd99582/sensors-21-07111-g012a.jpg
https://cdn.ncbi.nlm.nih.gov/pmc/blobs/e3bc/8587789/8a281ecf0d34/sensors-21-07111-g013.jpg
https://cdn.ncbi.nlm.nih.gov/pmc/blobs/e3bc/8587789/50eb9d558fb2/sensors-21-07111-g014.jpg
https://cdn.ncbi.nlm.nih.gov/pmc/blobs/e3bc/8587789/5eefd3f9a660/sensors-21-07111-g015.jpg
https://cdn.ncbi.nlm.nih.gov/pmc/blobs/e3bc/8587789/b8e9ab10f880/sensors-21-07111-g016.jpg

相似文献

1
An Empathy Evaluation System Using Spectrogram Image Features of Audio.基于音频声谱图特征的共情评估系统
Sensors (Basel). 2021 Oct 26;21(21):7111. doi: 10.3390/s21217111.
2
Soundscapes of morality: Linking music preferences and moral values through lyrics and audio.道德的声音景观:通过歌词和音频将音乐偏好与道德价值观联系起来。
PLoS One. 2023 Nov 29;18(11):e0294402. doi: 10.1371/journal.pone.0294402. eCollection 2023.
3
A Music Emotion Classification Model Based on the Improved Convolutional Neural Network.基于改进卷积神经网络的音乐情绪分类模型。
Comput Intell Neurosci. 2022 Feb 14;2022:6749622. doi: 10.1155/2022/6749622. eCollection 2022.
4
A Multimodal Convolutional Neural Network Model for the Analysis of Music Genre on Children's Emotions Influence Intelligence.用于分析音乐类型对儿童情绪智力影响的多模态卷积神经网络模型。
Comput Intell Neurosci. 2022 Aug 29;2022:5611456. doi: 10.1155/2022/5611456. eCollection 2022.
5
Music video emotion classification using slow-fast audio-video network and unsupervised feature representation.基于快慢音视频网络和无监督特征表示的音乐视频情感分类。
Sci Rep. 2021 Oct 6;11(1):19834. doi: 10.1038/s41598-021-98856-2.
6
Music Waveform Analysis Based on SOM Neural Network and Big Data.基于 SOM 神经网络和大数据的音乐波形分析。
Comput Intell Neurosci. 2021 Sep 3;2021:9714988. doi: 10.1155/2021/9714988. eCollection 2021.
7
Speech emotion recognition using machine learning techniques: Feature extraction and comparison of convolutional neural network and random forest.基于机器学习技术的语音情感识别:卷积神经网络和随机森林的特征提取与比较。
PLoS One. 2023 Nov 21;18(11):e0291500. doi: 10.1371/journal.pone.0291500. eCollection 2023.
8
Using machine learning analysis to interpret the relationship between music emotion and lyric features.运用机器学习分析来阐释音乐情感与歌词特征之间的关系。
PeerJ Comput Sci. 2021 Nov 15;7:e785. doi: 10.7717/peerj-cs.785. eCollection 2021.
9
Predicting the perception of performed dynamics in music audio with ensemble learning.利用集成学习预测音乐音频中演奏动态的感知。
J Acoust Soc Am. 2017 Mar;141(3):2224. doi: 10.1121/1.4978245.
10
Sex Detection of Chicks Based on Audio Technology and Deep Learning Methods.基于音频技术和深度学习方法的雏鸡性别检测
Animals (Basel). 2022 Nov 10;12(22):3106. doi: 10.3390/ani12223106.

引用本文的文献

1
An Audiovisual Correlation Matching Method Based on Fine-Grained Emotion and Feature Fusion.基于细粒度情感和特征融合的视听相关匹配方法。
Sensors (Basel). 2024 Aug 31;24(17):5681. doi: 10.3390/s24175681.

本文引用的文献

1
Novel Entropy and Rotation Forest-Based Credal Decision Tree Classifier for Landslide Susceptibility Modeling.基于新型熵和旋转森林的证据决策树分类器用于滑坡易发性建模
Entropy (Basel). 2019 Jan 23;21(2):106. doi: 10.3390/e21020106.
2
Vagal Tone Differences in Empathy Level Elicited by Different Emotions and a Co-Viewer.不同情绪和共同观看者引发的同理心水平的迷走神经紧张度差异。
Sensors (Basel). 2020 Jun 1;20(11):3136. doi: 10.3390/s20113136.
3
Recognition of Emotion According to the Physical Elements of the Video.根据视频的物理元素识别情绪。
Sensors (Basel). 2020 Jan 24;20(3):649. doi: 10.3390/s20030649.
4
Human Emotion Recognition: Review of Sensors and Methods.人类情感识别:传感器与方法综述。
Sensors (Basel). 2020 Jan 21;20(3):592. doi: 10.3390/s20030592.
5
Heuristic filter feature selection methods for medical datasets.启发式过滤器特征选择方法在医疗数据集上的应用。
Genomics. 2020 Mar;112(2):1173-1181. doi: 10.1016/j.ygeno.2019.07.002. Epub 2019 Jul 2.
6
Is there a core neural network in empathy? An fMRI based quantitative meta-analysis.共情是否存在核心神经网络?一项基于 fMRI 的定量元分析。
Neurosci Biobehav Rev. 2011 Jan;35(3):903-11. doi: 10.1016/j.neubiorev.2010.10.009. Epub 2010 Oct 23.
7
YIN, a fundamental frequency estimator for speech and music.YIN,一种用于语音和音乐的基频估计器。
J Acoust Soc Am. 2002 Apr;111(4):1917-30. doi: 10.1121/1.1458024.
8
Nature over nurture: temperament, personality, and life span development.先天优于后天培养:气质、性格与毕生发展
J Pers Soc Psychol. 2000 Jan;78(1):173-86. doi: 10.1037//0022-3514.78.1.173.