Autism Research Centre, Department of Psychiatry, University of Cambridge, Cambridge, UK.
Brain Mapping Unit, Department of Psychiatry, University of Cambridge, Cambridge, UK.
Nature. 2022 Apr;604(7906):525-533. doi: 10.1038/s41586-022-04554-y. Epub 2022 Apr 6.
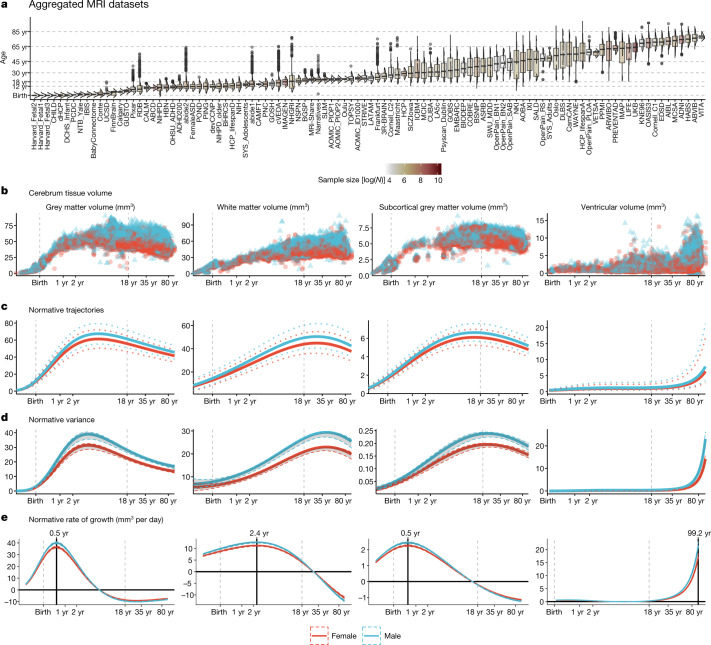
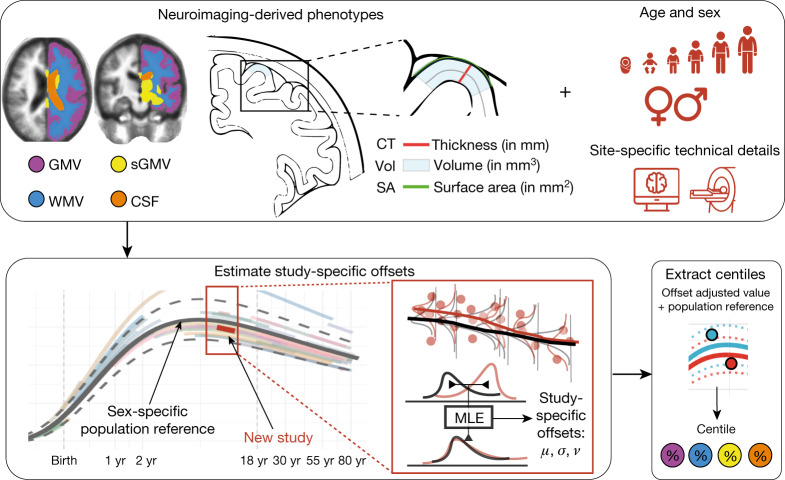
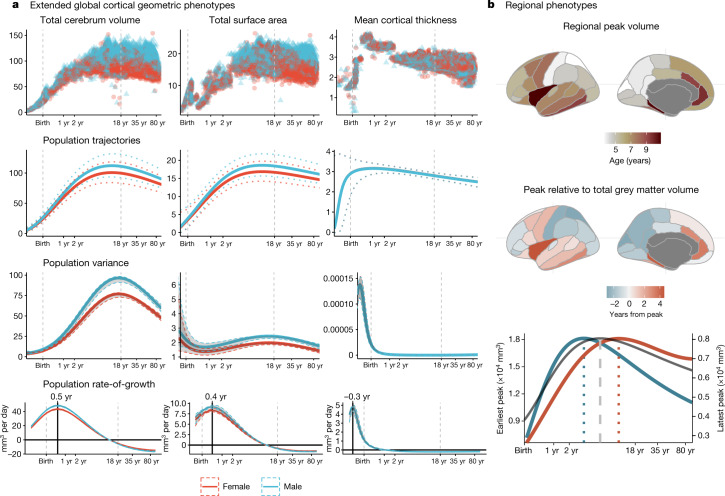
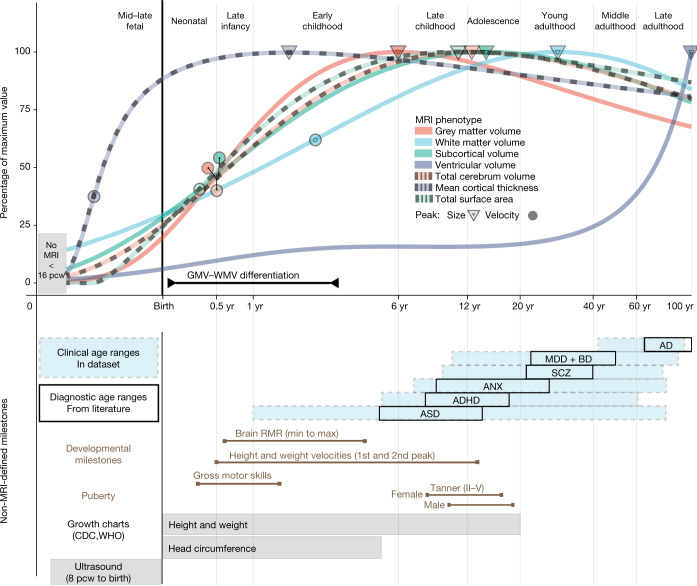
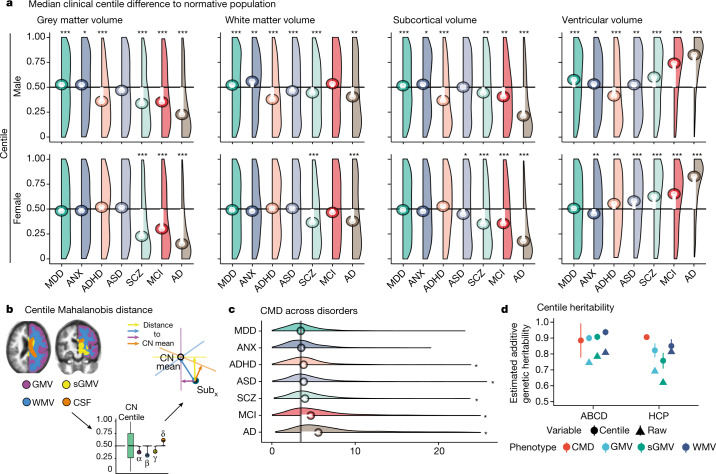
Over the past few decades, neuroimaging has become a ubiquitous tool in basic research and clinical studies of the human brain. However, no reference standards currently exist to quantify individual differences in neuroimaging metrics over time, in contrast to growth charts for anthropometric traits such as height and weight. Here we assemble an interactive open resource to benchmark brain morphology derived from any current or future sample of MRI data ( http://www.brainchart.io/ ). With the goal of basing these reference charts on the largest and most inclusive dataset available, acknowledging limitations due to known biases of MRI studies relative to the diversity of the global population, we aggregated 123,984 MRI scans, across more than 100 primary studies, from 101,457 human participants between 115 days post-conception to 100 years of age. MRI metrics were quantified by centile scores, relative to non-linear trajectories of brain structural changes, and rates of change, over the lifespan. Brain charts identified previously unreported neurodevelopmental milestones, showed high stability of individuals across longitudinal assessments, and demonstrated robustness to technical and methodological differences between primary studies. Centile scores showed increased heritability compared with non-centiled MRI phenotypes, and provided a standardized measure of atypical brain structure that revealed patterns of neuroanatomical variation across neurological and psychiatric disorders. In summary, brain charts are an essential step towards robust quantification of individual variation benchmarked to normative trajectories in multiple, commonly used neuroimaging phenotypes.
在过去的几十年中,神经影像学已成为基础研究和人类大脑临床研究中无处不在的工具。然而,与身高和体重等人体测量特征的生长图表不同,目前尚无参考标准来量化随时间变化的神经影像学指标的个体差异。在这里,我们汇集了一个互动的开放资源,以基准化源自任何当前或未来 MRI 数据样本的大脑形态(http://www.brainchart.io/)。我们的目标是基于可用的最大和最具包容性的数据集来建立这些参考图表,同时承认由于 MRI 研究相对于全球人口多样性存在已知偏差,因此存在局限性,我们汇集了来自 101457 名人类参与者的 123984 次 MRI 扫描,跨越 100 多项主要研究,涵盖从受孕后 115 天到 100 岁的年龄范围。MRI 指标通过百分位数评分进行量化,相对于大脑结构变化的非线性轨迹和寿命期间的变化率。大脑图表确定了以前未报告的神经发育里程碑,显示出个体在纵向评估中的高度稳定性,并证明了对主要研究之间的技术和方法差异具有鲁棒性。与非百分位 MRI 表型相比,百分位评分显示出更高的遗传性,并且提供了一种标准化的方法来衡量异常大脑结构,揭示了神经解剖学变异在神经和精神疾病中的模式。总之,大脑图表是朝着使用多个常用神经影像学表型对个体变异进行稳健量化并与规范轨迹进行基准化的重要一步。