Department of Radiology, Mie University School of Medicine, 2-174 Edobashi, Tsu, Mie, Japan.
Department of Neuroradiology, Mie University School of Medicine, 2-174 Edobashi, Tsu, Mie, Japan.
Sci Rep. 2022 Apr 8;12(1):5947. doi: 10.1038/s41598-022-09968-2.
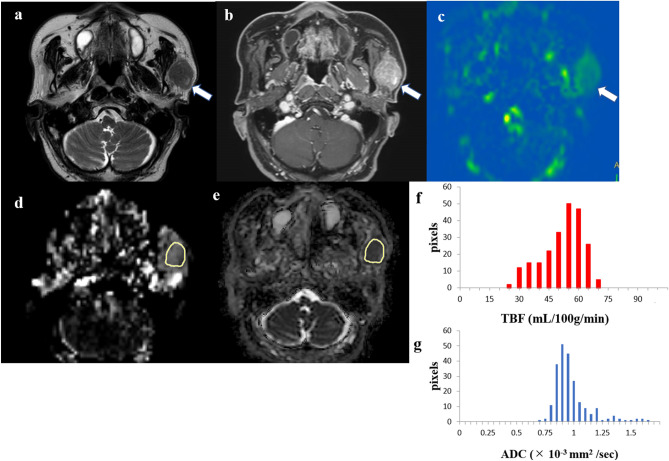
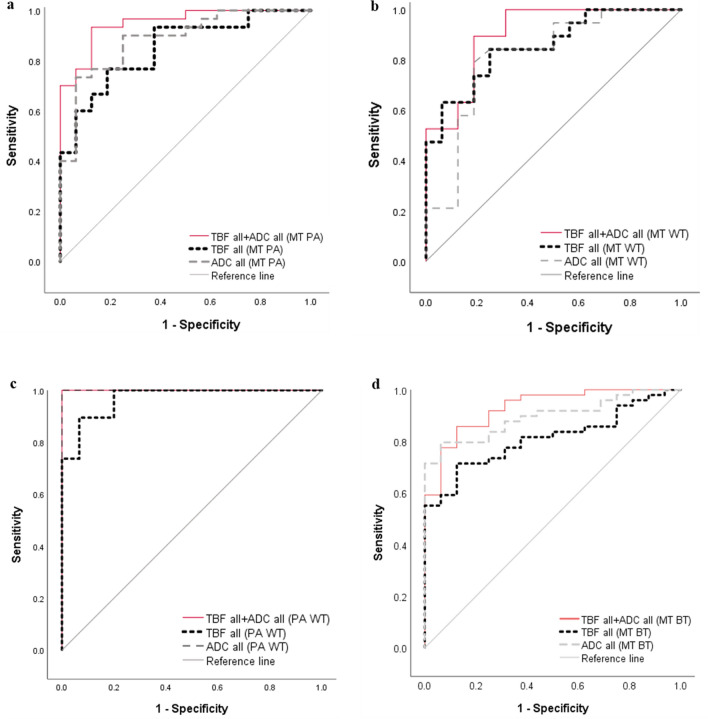
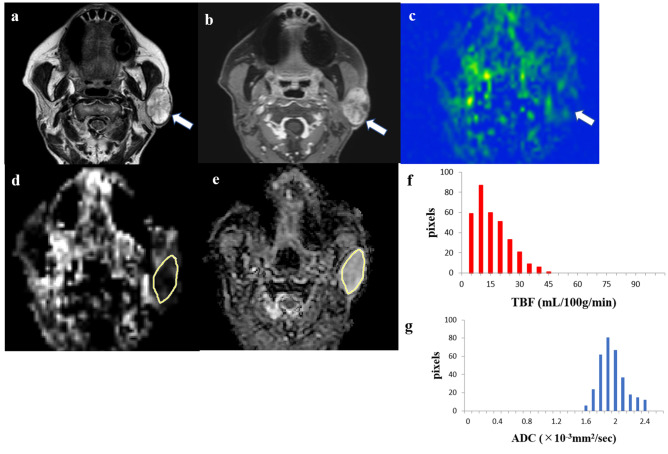
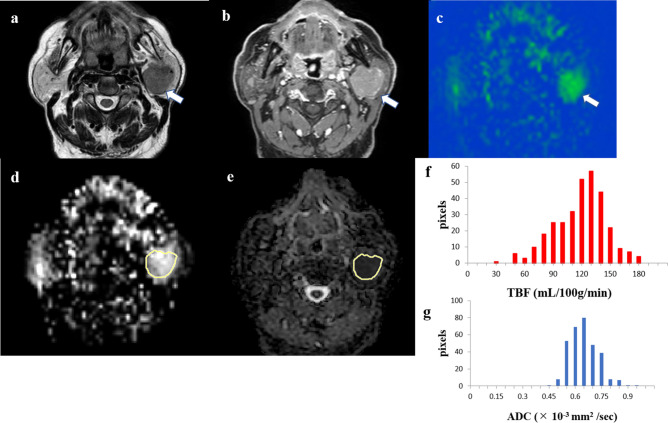
We aimed to assess the combined diagnostic value of apparent diffusion coefficient (ADC) and tumor blood flow (TBF) obtained by pseudocontinuous arterial spin labeling (pCASL) for differentiating malignant tumors (MTs) in salivary glands from pleomorphic adenomas (PAs) and Warthin's tumors (WTs). We used pCASL imaging and ADC map to evaluate 65 patients, including 16 with MT, 30 with PA, and 19 with WT. We evaluated all tumors by histogram analyses and compared various characteristics by one-way analysis of variance followed by Tukey post-hoc tests. Diagnostic performance was evaluated by receiver operating characteristic (ROC) curve analysis. There were significant differences in the mean, 50th, 75th, and 90th percentiles of TBF among the tumor types, in the mean TBFs (mL/100 g/min) between MTs (57.47 ± 35.14) and PAs (29.88 ± 22.53, p = 0.039) and between MTs and WTs (119.31 ± 50.11, p < 0.001), as well as in the mean ADCs (× 10 mm/s) between MTs (1.08 ± 0.28) and PAs (1.60 ± 0.34, p < 0.001), but not in the mean ADCs between MTs and WTs (0.87 ± 0.23, p = 0.117). In the ROC curve analysis, the highest areas under the curves (AUCs) were achieved by the 10th and 25th percentiles of ADC (AUC = 0.885) for differentiating MTs from PAs and the 50th percentile of TBF (AUC = 0.855) for differentiating MTs from WTs. The AUCs of TBF, ADC, and combination of TBF and ADC were 0.850, 0.885, and 0.950 for MTs and PAs differentiation and 0.855, 0.814, and 0.905 for MTs and WTs differentiation, respectively. The combination of TBF and ADC evaluated by histogram analysis may help differentiate salivary gland MTs from PAs and WTs.
我们旨在评估通过假性连续动脉自旋标记(pCASL)获得的表观扩散系数(ADC)和肿瘤血流(TBF)联合诊断在区分唾液腺中的恶性肿瘤(MTs)与多形性腺瘤(PAs)和沃辛瘤(WTs)的价值。我们使用 pCASL 成像和 ADC 图评估了 65 名患者,其中包括 16 名 MT 患者、30 名 PA 患者和 19 名 WT 患者。我们通过直方图分析评估了所有肿瘤,并通过单向方差分析(ANOVA)和 Tukey 事后检验比较了各种特征。通过受试者工作特征(ROC)曲线分析评估诊断性能。在肿瘤类型之间,TBF 的均值、50%、75%和 90%百分位数、MTs(57.47±35.14)与 PAs(29.88±22.53,p=0.039)之间的平均 TBF 以及 MTs 与 WTs(119.31±50.11,p<0.001)之间存在显著差异,而 MTs(1.08±0.28)与 PAs(1.60±0.34,p<0.001)之间的平均 ADC 也存在显著差异,但 MTs 与 WTs 之间的平均 ADC 无显著差异(0.87±0.23,p=0.117)。在 ROC 曲线分析中,ADC 的第 10 百分位数和第 25 百分位数(AUC=0.885)在区分 MTs 与 PAs 方面的曲线下面积(AUC)最高,TBF 的第 50 百分位数(AUC=0.855)在区分 MTs 与 WTs 方面的 AUC 最高。TBF、ADC 和 TBF 与 ADC 联合的 AUC 分别为 0.850、0.885 和 0.950,用于区分 MTs 与 PAs;0.855、0.814 和 0.905,用于区分 MTs 与 WTs。通过直方图分析评估的 TBF 和 ADC 的联合可以帮助区分唾液腺 MTs 与 PAs 和 WTs。