• 文献检索
  • 文档翻译
  • 深度研究
  • 学术资讯
  • Suppr Zotero 插件Zotero 插件
  • 邀请有礼
  • 套餐&价格
  • 历史记录
应用&插件
Suppr Zotero 插件Zotero 插件浏览器插件Mac 客户端Windows 客户端微信小程序
定价
高级版会员购买积分包购买API积分包
服务
文献检索文档翻译深度研究API 文档MCP 服务
关于我们
关于 Suppr公司介绍联系我们用户协议隐私条款
关注我们

Suppr 超能文献

核心技术专利:CN118964589B侵权必究
粤ICP备2023148730 号-1Suppr @ 2026

文献检索

告别复杂PubMed语法,用中文像聊天一样搜索,搜遍4000万医学文献。AI智能推荐,让科研检索更轻松。

立即免费搜索

文件翻译

保留排版,准确专业,支持PDF/Word/PPT等文件格式,支持 12+语言互译。

免费翻译文档

深度研究

AI帮你快速写综述,25分钟生成高质量综述,智能提取关键信息,辅助科研写作。

立即免费体验

2001-2019 年美国的政治环境与死亡率:基于人群的横断面分析。

Political environment and mortality rates in the United States, 2001-19: population based cross sectional analysis.

机构信息

Department of Medicine, Cardiology Section, VA Boston Healthcare System, Boston, MA, USA

Division of Cardiovascular Medicine, Department of Medicine, Brigham and Women's Hospital, Boston, MA, USA.

出版信息

BMJ. 2022 Jun 7;377:e069308. doi: 10.1136/bmj-2021-069308.

DOI:10.1136/bmj-2021-069308
PMID:35672032
原文链接:https://pmc.ncbi.nlm.nih.gov/articles/PMC9171631/
Abstract

OBJECTIVE

To assess recent trends in age adjusted mortality rates (AAMRs) in the United States based on county level presidential voting patterns.

DESIGN

Cross sectional study.

SETTING

USA, 2001-19.

PARTICIPANTS

99.8% of the US population.

MAIN OUTCOME MEASURES

AAMR per 100 000 population and average annual percentage change (APC).

METHODS

The Centers for Disease Control and Prevention WONDER database was linked to county level data on US presidential elections. County political environment was classified as either Democratic or Republican for the four years that followed a November presidential election. Additional sensitivity analyses analyzed AAMR trends for counties that voted only for one party throughout the study, and county level gubernatorial election results and state level AAMR trends. Joinpoint analysis was used to assess for an inflection point in APC trends.

RESULTS

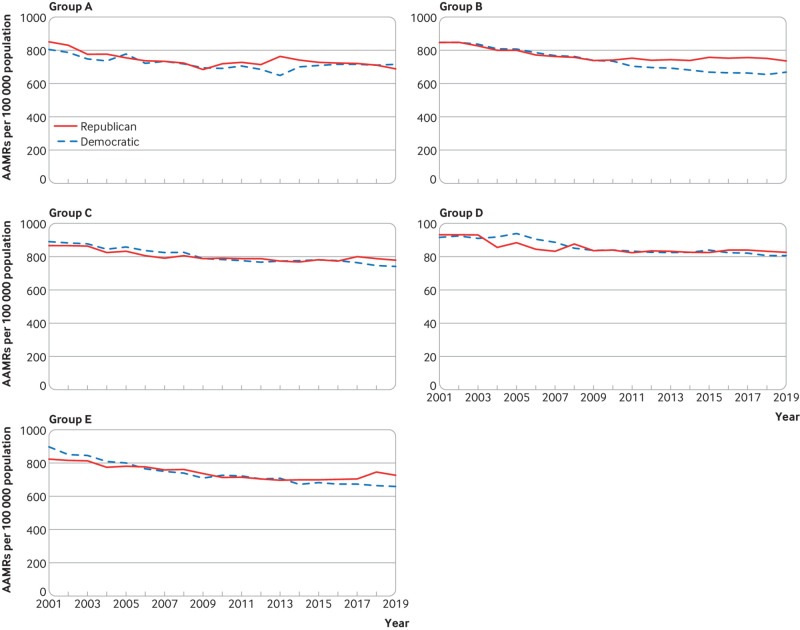
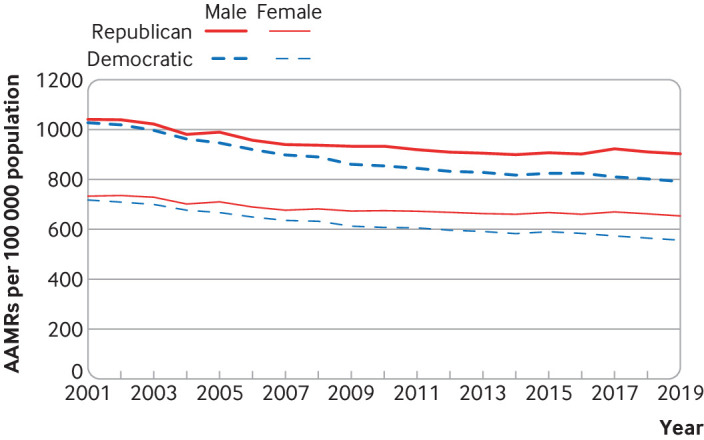
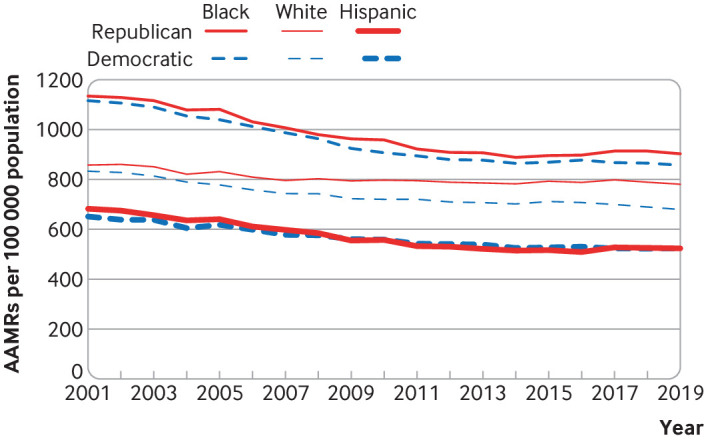
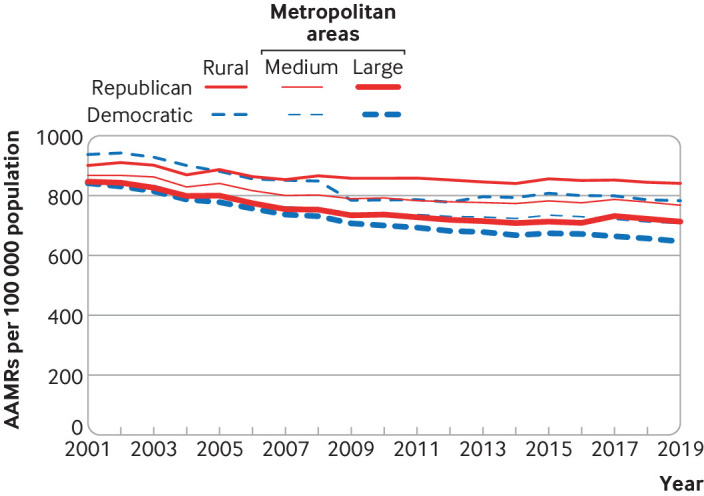
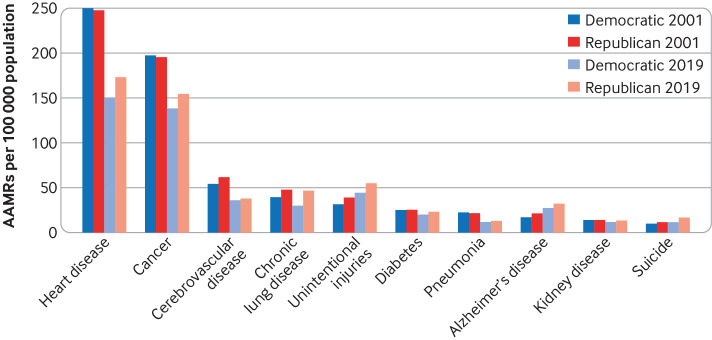
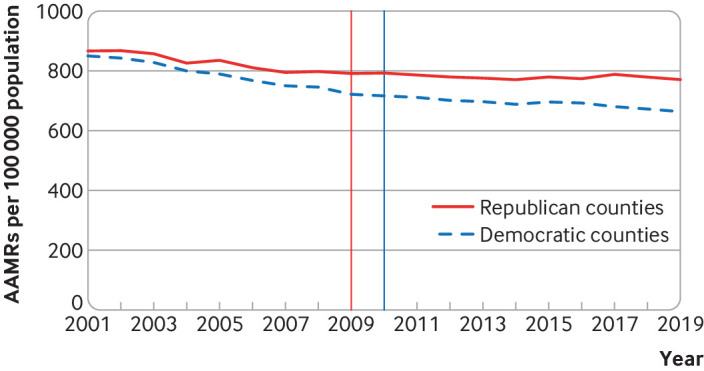
The study period covered five presidential elections from 2000 to 2019. From 2001 to 2019, the AAMR per 100 000 population decreased by 22% in Democratic counties, from 850.3 to 664.0 (average APC -1.4%, 95% confidence interval -1.5% to -1.2%), but by only 11% in Republican counties, from 867.0 to 771.1 (average APC -0.7%, -0.9% to -0.5%). The gap in AAMR between Democratic and Republican counties therefore widened from 16.7 (95% confidence interval 16.6 to 16.8) to 107.1 (106.5 to 107.7). Statistically significant inflection points in APC occurred for Democratic counties between periods 2001-09 (APC -2.1%, -2.3% to -1.9%) and 2009-19 (APC -0.8%, -1.0% to -0.6%). For Republican counties between 2001 and 2008 the APC was -1.4% (-1.8% to -1.0%), slowing to near zero between 2008 and 2019 (APC -0.2%, -0.4% to 0.0%). Male and female residents of Democratic counties experienced both lower AAMR and twice the relative decrease in AAMR than did those in Republican counties. Black Americans experienced largely similar improvement in AAMR in both Democratic and Republican counties. However, the AAMR gap between white residents in Democratic versus Republican counties increased fourfold, from 24.7 (95% confidence interval 24.6 to 24.8) to 101.3 (101.0 to 101.6). Rural Republican counties experienced the highest AAMR and the least improvement. All trends were similar when comparing counties that did not switch political environment throughout the period and when gubernatorial election results were used. The greatest contributors to the widening AAMR gap between Republican and Democratic counties were heart disease (difference in AAMRs 27.6), cancer (17.3), and chronic lower respiratory tract diseases (8.3), followed by unintentional injuries (3.3) and suicide (3.0).

CONCLUSION

The mortality gap in Republican voting counties compared with Democratic voting counties has grown over time, especially for white populations, and that gap began to widen after 2008.

https://cdn.ncbi.nlm.nih.gov/pmc/blobs/363e/9171631/41daae61ae04/warh069308.f6.jpg
https://cdn.ncbi.nlm.nih.gov/pmc/blobs/363e/9171631/dcccc764ac65/warh069308.f1.jpg
https://cdn.ncbi.nlm.nih.gov/pmc/blobs/363e/9171631/6dccb24c71b4/warh069308.f2.jpg
https://cdn.ncbi.nlm.nih.gov/pmc/blobs/363e/9171631/5a109878699b/warh069308.f3.jpg
https://cdn.ncbi.nlm.nih.gov/pmc/blobs/363e/9171631/68be3b592798/warh069308.f4.jpg
https://cdn.ncbi.nlm.nih.gov/pmc/blobs/363e/9171631/9b04c655a928/warh069308.f5.jpg
https://cdn.ncbi.nlm.nih.gov/pmc/blobs/363e/9171631/41daae61ae04/warh069308.f6.jpg
摘要

目的

根据县一级总统投票模式评估美国年龄调整死亡率(AAMR)的近期趋势。

设计

横断面研究。

地点

美国,2001-19 年。

参与者

99.8%的美国人口。

主要观察指标

每 10 万人的 AAMR 和平均年百分比变化(APC)。

方法

疾病控制和预防中心的 WONDER 数据库与美国总统选举的县一级数据相关联。在 11 月总统选举后的四年内,县一级政治环境被归类为民主党或共和党。此外,敏感性分析还分析了整个研究期间只投票给一方的县的 AAMR 趋势,以及县一级州长选举结果和州一级 AAMR 趋势。使用 Joinpoint 分析评估 APC 趋势的拐点。

结果

研究期间涵盖了 2000 年至 2019 年的五次总统选举。从 2001 年到 2019 年,民主党县的每 10 万人死亡率下降了 22%,从 850.3 降至 664.0(APC 平均为-1.4%,95%置信区间为-1.5%至-1.2%),而共和党县的死亡率仅下降了 11%,从 867.0 降至 771.1(APC 平均为-0.7%,-0.9%至-0.5%)。因此,民主和共和两党县之间的 AAMR 差距从 16.7(95%置信区间 16.6 至 16.8)扩大到 107.1(106.5 至 107.7)。民主党县的 APC 在 2001-09 年(APC-2.1%,-2.3%至-1.9%)和 2009-19 年(APC-0.8%,-1.0%至-0.6%)期间出现了统计学上显著的拐点。2001 年至 2008 年,共和党县的 APC 为-1.4%(-1.8%至-1.0%),2008 年至 2019 年期间放缓至接近零(APC-0.2%,-0.4%至 0.0%)。民主党的男性和女性居民死亡率都较低,AAMR 的相对降幅是共和党的两倍。非裔美国人在民主和共和两党县的 AAMR 都有了很大的改善。然而,白人和共和党县居民之间的 AAMR 差距增加了四倍,从 24.7(95%置信区间 24.6 至 24.8)增加到 101.3(101.0 至 101.6)。农村共和党县的死亡率最高,改善最小。当比较整个时期政治环境没有变化的县以及使用州长选举结果时,所有趋势都是相似的。导致共和党和民主党县之间 AAMR 差距扩大的最大因素是心脏病(AAMR 差异 27.6)、癌症(17.3)和慢性下呼吸道疾病(8.3),其次是意外伤害(3.3)和自杀(3.0)。

结论

与投票给民主党的县相比,共和党投票的县的死亡率差距随着时间的推移而扩大,尤其是对白人人口而言,自 2008 年以来,这一差距开始扩大。

相似文献

1
Political environment and mortality rates in the United States, 2001-19: population based cross sectional analysis.2001-2019 年美国的政治环境与死亡率:基于人群的横断面分析。
BMJ. 2022 Jun 7;377:e069308. doi: 10.1136/bmj-2021-069308.
2
Independent Relationship of Changes in Death Rates with Changes in US Presidential Voting.死亡率变化与美国总统选举投票变化的独立关系。
J Gen Intern Med. 2019 Mar;34(3):363-371. doi: 10.1007/s11606-018-4568-6. Epub 2018 Sep 5.
3
Excess Death Rates for Republican and Democratic Registered Voters in Florida and Ohio During the COVID-19 Pandemic.共和党和民主党在佛罗里达州和俄亥俄州的选民在 COVID-19 大流行期间的超额死亡率。
JAMA Intern Med. 2023 Sep 1;183(9):916-923. doi: 10.1001/jamainternmed.2023.1154.
4
Swing voting in the 2016 presidential election in counties where midlife mortality has been rising in white non-Hispanic Americans.摇摆州的 2016 总统选举中,中年白人和非西班牙裔美国人的死亡率一直在上升。
Soc Sci Med. 2018 Jan;197:33-38. doi: 10.1016/j.socscimed.2017.11.050. Epub 2017 Dec 2.
5
Diverging Life Expectancies and Voting Patterns in the 2016 US Presidential Election.2016年美国总统大选中不同的预期寿命与投票模式
Am J Public Health. 2017 Oct;107(10):1560-1562. doi: 10.2105/AJPH.2017.303945. Epub 2017 Aug 17.
6
Potentially Excess Deaths from the Five Leading Causes of Death in Metropolitan and Nonmetropolitan Counties - United States, 2010-2017.大都市和县和非大都市县五个主要死因的潜在超额死亡人数-美国,2010-2017 年。
MMWR Surveill Summ. 2019 Nov 8;68(10):1-11. doi: 10.15585/mmwr.ss6810a1.
7
Along party Lines: Examining the gubernatorial party difference in COVID-19 mortality rates in U.S. Counties.党派分歧:审视美国各县州长所在政党在新冠疫情死亡率上的差异
Prev Med Rep. 2023 Apr;32:102142. doi: 10.1016/j.pmedr.2023.102142. Epub 2023 Feb 13.
8
State-level political partisanship strongly correlates with health outcomes for US children.美国各州政治党派之争与儿童健康状况密切相关。
Eur J Pediatr. 2022 Jan;181(1):273-280. doi: 10.1007/s00431-021-04203-y. Epub 2021 Jul 17.
9
Trends in heart failure-related cardiovascular mortality in rural versus urban United States counties, 2011-2018: A cross-sectional study.2011 - 2018年美国农村与城市县心力衰竭相关心血管死亡率趋势:一项横断面研究。
PLoS One. 2021 Mar 3;16(3):e0246813. doi: 10.1371/journal.pone.0246813. eCollection 2021.
10
Associations of presidential voting preference and gubernatorial control with county-level COVID-19 case and death rates in the continental United States.在美国大陆,总统选举偏好和州长控制与县级 COVID-19 病例和死亡率的关联。
Public Health. 2021 Sep;198:161-163. doi: 10.1016/j.puhe.2021.07.038. Epub 2021 Aug 27.

引用本文的文献

1
Threats to Democracy and the Right to Health.对民主和健康权的威胁。
Am J Public Health. 2025 Mar;115(3):307-309. doi: 10.2105/AJPH.2024.307992.
2
Politicians, power, and the people's health: US elections and state health outcomes, 2012-2024.政治家、权力与民众健康:2012 - 2024年美国选举与各州健康状况
Health Aff Sch. 2024 Nov 27;2(12):qxae163. doi: 10.1093/haschl/qxae163. eCollection 2024 Dec.
3
Racialized environments and syringe services program implementation: County-level factors.种族化环境与注射器具提供计划实施:县级因素。

本文引用的文献

1
The Growing Influence of State Governments on Population Health in the United States.美国州政府对人口健康的影响日益增大。
JAMA. 2022 Apr 12;327(14):1331-1332. doi: 10.1001/jama.2022.3785.
2
Viewing the US presidential electoral map through the lens of public health.从公共卫生角度看美国总统选举地图。
PLoS One. 2021 Jul 21;16(7):e0254001. doi: 10.1371/journal.pone.0254001. eCollection 2021.
3
Life expectancy and voting patterns in the 2020 U.S. presidential election.2020年美国总统大选中的预期寿命与投票模式。
Drug Alcohol Depend. 2024 Oct 1;263:112430. doi: 10.1016/j.drugalcdep.2024.112430. Epub 2024 Aug 28.
4
Political voting in the United Kingdom 2019 general election and risk of living with obesity in a nationally representative sample.2019 年英国大选的政治投票与全国代表性样本中肥胖风险的关系。
Int J Obes (Lond). 2024 Oct;48(10):1430-1437. doi: 10.1038/s41366-024-01569-5. Epub 2024 Jun 26.
5
Geographic access to pediatric neurosurgeons in the USA: an analysis of sociodemographic factors.美国儿科神经外科医生的地理可达性:社会人口因素分析。
Childs Nerv Syst. 2024 Mar;40(3):905-912. doi: 10.1007/s00381-023-06172-z. Epub 2023 Oct 4.
6
Association Between Partisan Affiliation of State Governments and State Mortality Rates Before and During the COVID-19 Pandemic.党派隶属的州政府与新冠疫情大流行前后的州死亡率之间的关联。
Milbank Q. 2023 Dec;101(4):1191-1222. doi: 10.1111/1468-0009.12672. Epub 2023 Sep 14.
7
State Government Policy Responses to the COVID-19 Pandemic in the United States 2020-2022: Concordant Heterogeneity?2020 - 2022年美国州政府对新冠疫情的政策应对:协调一致的异质性?
Med Res Arch. 2023 Apr;11(4). doi: 10.18103/mra.v11i4.3693.
8
Excess Death Rates for Republican and Democratic Registered Voters in Florida and Ohio During the COVID-19 Pandemic.共和党和民主党在佛罗里达州和俄亥俄州的选民在 COVID-19 大流行期间的超额死亡率。
JAMA Intern Med. 2023 Sep 1;183(9):916-923. doi: 10.1001/jamainternmed.2023.1154.
9
Community-level age bias and older adult mortality.社区层面的年龄歧视与老年人口死亡率。
Soc Sci Med. 2023 Jan;317:115449. doi: 10.1016/j.socscimed.2022.115449. Epub 2022 Nov 21.
10
American election results at the precinct level.美国选区级别的选举结果。
Sci Data. 2022 Nov 3;9(1):651. doi: 10.1038/s41597-022-01745-0.
SSM Popul Health. 2021 Jun 8;15:100840. doi: 10.1016/j.ssmph.2021.100840. eCollection 2021 Sep.
4
Rural-Urban Disparity in Mortality in the US From 1999 to 2019.1999 年至 2019 年美国城乡死亡率差异。
JAMA. 2021 Jun 8;325(22):2312-2314. doi: 10.1001/jama.2021.5334.
5
Partisanship, health behavior, and policy attitudes in the early stages of the COVID-19 pandemic. partisanship, health behavior, and policy attitudes in the early stages of the COVID-19 pandemic
PLoS One. 2021 Apr 7;16(4):e0249596. doi: 10.1371/journal.pone.0249596. eCollection 2021.
6
Factors Associated With US Adults' Likelihood of Accepting COVID-19 Vaccination.与美国成年人接受 COVID-19 疫苗意愿相关的因素。
JAMA Netw Open. 2020 Oct 1;3(10):e2025594. doi: 10.1001/jamanetworkopen.2020.25594.
7
Polarization and public health: Partisan differences in social distancing during the coronavirus pandemic.两极分化与公共卫生:新冠疫情期间社会 distancing 方面的党派差异。 (注:这里“social distancing”常见释义为“社交距离” ,但原文中该词似乎有误,可能是“social distancing measures”之类表述会更准确,直接翻译的话就是“社会距离” )
J Public Econ. 2020 Nov;191:104254. doi: 10.1016/j.jpubeco.2020.104254. Epub 2020 Aug 6.
8
US State Policies, Politics, and Life Expectancy.美国的州政策、政治与预期寿命
Milbank Q. 2020 Sep;98(3):668-699. doi: 10.1111/1468-0009.12469. Epub 2020 Aug 4.
9
Association of Chronic Opioid Use With Presidential Voting Patterns in US Counties in 2016.2016 年美国各县慢性阿片类药物使用与总统投票模式的关联。
JAMA Netw Open. 2018 Jun 1;1(2):e180450. doi: 10.1001/jamanetworkopen.2018.0450.
10
Health Care in the 2018 Election.2018年选举中的医疗保健
N Engl J Med. 2018 Nov 1;379(18):e32. doi: 10.1056/NEJMsr1813425.