Department of Preventive Medicine and Community Health, University of Texas Medical Branch, Galveston.
Departments of Medicine, University of Texas Medical Branch, Galveston.
JAMA Netw Open. 2018 Jun 1;1(2):e180450. doi: 10.1001/jamanetworkopen.2018.0450.
The causes of the opioid epidemic are incompletely understood.
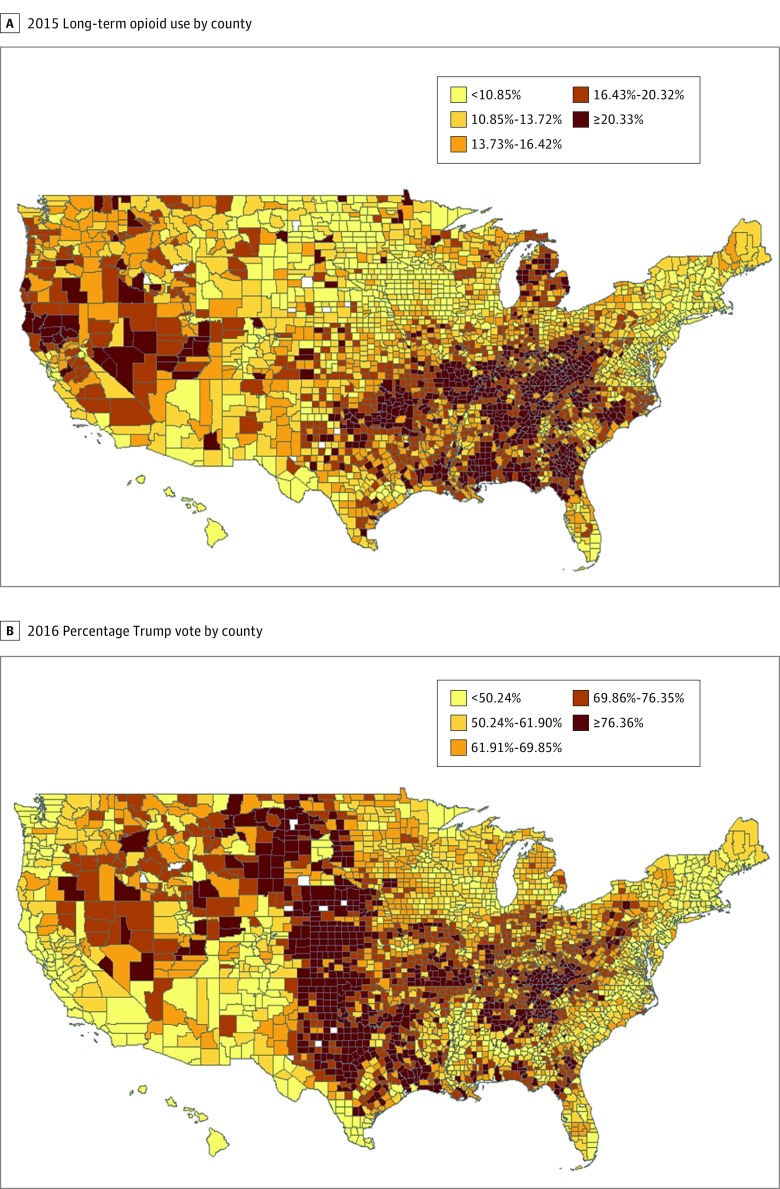
To explore the overlap between the geographic distribution of US counties with high opioid use and the vote for the Republican candidate in the 2016 presidential election.
DESIGN, SETTING, AND PARTICIPANTS: A cross-sectional analysis to explore the extent to which individual- and county-level demographic and economic measures explain the association of opioid use with the 2016 presidential vote at the county level, using rate of prescriptions for at least a 90-day supply of opioids in 2015. Medicare Part D enrollees (N = 3 764 361) constituting a 20% national sample were included.
Chronic opioid use was measured by county rate of receiving a 90-day or greater supply of opioids prescribed in 2015.
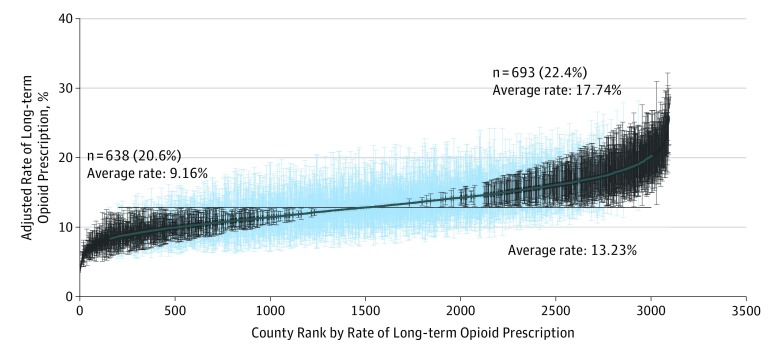
Of the 3 764 361 Medicare Part D enrollees in the 20% sample, 679 314 (18.0%) were younger than 65 years, 2 283 007 (60.6%) were female, 3 053 688 (81.1%) were non-Hispanic white, 351 985 (9.3%) were non-Hispanic black, and 198 778 (5.3%) were Hispanic. In a multilevel analysis including county and enrollee, the county of residence explained 9.2% of an enrollee's odds of receiving prolonged opioids after adjusting for individual enrollee characteristics. The correlation between a county's Republican presidential vote and the adjusted rate of Medicare Part D recipients receiving prescriptions for prolonged opioid use was 0.42 (P < .001). In the 693 counties with adjusted rates of opioid prescription significantly higher than the mean county rate, the mean (SE) Republican presidential vote was 59.96% (1.73%), vs 38.67% (1.15%) in the 638 counties with significantly lower rates. Adjusting for county-level socioeconomic measures in linear regression models explained approximately two-thirds of the association of opioid rates and presidential voting rates.
Support for the Republican candidate in the 2016 election is a marker for physical conditions, economic circumstances, and cultural forces associated with opioid use. The commonly used socioeconomic indicators do not totally capture all of those forces.
阿片类药物流行的原因尚不完全清楚。
探索美国高阿片类药物使用县的地理分布与 2016 年总统选举中共和党候选人投票之间的重叠。
设计、地点和参与者:一项横断面分析,旨在探讨个体和县级人口统计学和经济措施在多大程度上解释了 2015 年至少 90 天的阿片类药物处方率与 2016 年总统投票之间的关联,使用 2015 年的医疗保险处方药物中至少有 90 天供应量的阿片类药物的县率。包括医疗保险 D 部分(Medicare Part D)的 20%的全国样本(N=3764361 名)。
慢性阿片类药物使用由 2015 年接受 90 天或更长时间阿片类药物处方的县率来衡量。
在 20%样本的 3764361 名医疗保险 D 部分参保者中,有 679314(18.0%)年龄小于 65 岁,2283007(60.6%)为女性,3053688(81.1%)为非西班牙裔白人,351985(9.3%)为非西班牙裔黑人,198778(5.3%)为西班牙裔。在一项包括县和参保者的多水平分析中,居住的县解释了参保者在调整个体参保者特征后接受长期阿片类药物治疗的几率的 9.2%。县的共和党总统投票与调整后的医疗保险 D 部分接受长期阿片类药物处方的比例之间的相关性为 0.42(P<.001)。在调整后的阿片类药物处方率显著高于平均县率的 693 个县中,共和党总统投票的平均(SE)为 59.96%(1.73%),而在调整后的阿片类药物处方率显著较低的 638 个县中为 38.67%(1.15%)。在线性回归模型中调整县一级的社会经济措施后,阿片类药物率和总统投票率之间的关联约有三分之二得到了解释。
支持 2016 年选举中的共和党候选人是与阿片类药物使用相关的身体状况、经济情况和文化力量的标志。常用的社会经济指标并不能完全捕捉到所有这些力量。