Koch Tom
Department of Geography (Medical), University of British Columbia, Vancouver, BC, Canada.
Alton Medical Centre, Toronto, ON, Canada.
Patterns (N Y). 2022 Jun 10;3(6):100507. doi: 10.1016/j.patter.2022.100507.
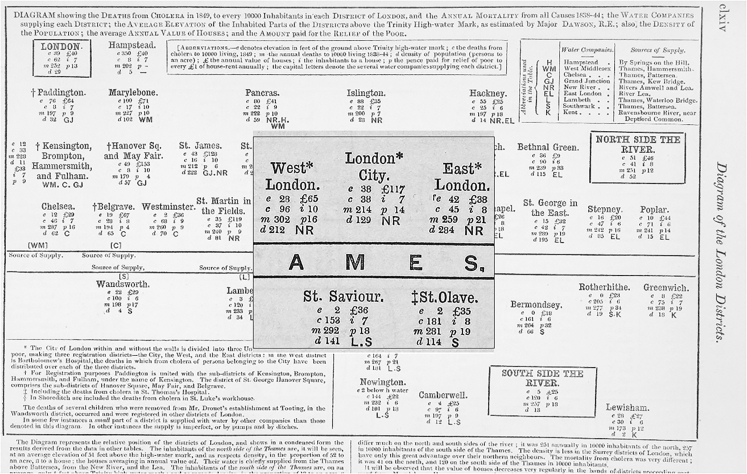
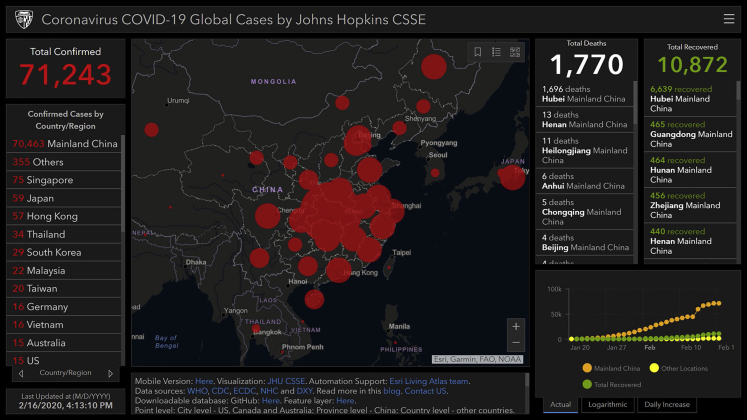
This paper presents a point in the transition of publicly available data and the means of its presentation. With syndromic mapping and new systems of data collection and distribution at all levels, previously privileged materials are now generally available. At the same time, the means of their analysis and presentation are being transformed by new systems of digital collaboration and presentation. With the coronavirus disease 2019 COVID-19) dashboard as an example, the history of both data and their presentation is presented as the backcloth against which the evolving systems of data collection and graphic presentation can be understood in a world of interactive research and Web 3.0.
本文阐述了公开可用数据及其呈现方式转变过程中的一个要点。随着症状监测绘图以及各级数据收集与分发新系统的出现,以前享有特权的资料现在已普遍可得。与此同时,其分析和呈现方式正被数字协作与呈现新系统所改变。以2019冠状病毒病(COVID-19)信息中心为例,数据及其呈现的历史被作为背景呈现出来,据此可在交互式研究和Web 3.0的环境中理解不断发展的数据收集和图形呈现系统。