• 文献检索
  • 文档翻译
  • 深度研究
  • 学术资讯
  • Suppr Zotero 插件Zotero 插件
  • 邀请有礼
  • 套餐&价格
  • 历史记录
应用&插件
Suppr Zotero 插件Zotero 插件浏览器插件Mac 客户端Windows 客户端微信小程序
定价
高级版会员购买积分包购买API积分包
服务
文献检索文档翻译深度研究API 文档MCP 服务
关于我们
关于 Suppr公司介绍联系我们用户协议隐私条款
关注我们

Suppr 超能文献

核心技术专利:CN118964589B侵权必究
粤ICP备2023148730 号-1Suppr @ 2026

文献检索

告别复杂PubMed语法,用中文像聊天一样搜索,搜遍4000万医学文献。AI智能推荐,让科研检索更轻松。

立即免费搜索

文件翻译

保留排版,准确专业,支持PDF/Word/PPT等文件格式,支持 12+语言互译。

免费翻译文档

深度研究

AI帮你快速写综述,25分钟生成高质量综述,智能提取关键信息,辅助科研写作。

立即免费体验

利用2020年4月至2022年4月的前瞻性时空扫描统计数据,探索日本长崎县新冠病毒感染的时空模式。

Exploring spatiotemporal patterns of COVID-19 infection in Nagasaki Prefecture in Japan using prospective space-time scan statistics from April 2020 to April 2022.

作者信息

Lu Yixiao, Cai Guoxi, Hu Zhijian, He Fei, Jiang Yixian, Aoyagi Kiyoshi

机构信息

Department of Public Health, Nagasaki University Graduate School of Biomedical Sciences, Nagasaki, 852-8523, Japan.

Public Health and Hygiene Research Department, Nagasaki Prefectural Institute of Environment and Public Health, Nagasaki, 856-0026, Japan.

出版信息

Arch Public Health. 2022 Jul 26;80(1):176. doi: 10.1186/s13690-022-00921-3.

DOI:10.1186/s13690-022-00921-3
PMID:35883103
原文链接:https://pmc.ncbi.nlm.nih.gov/articles/PMC9315091/
Abstract

BACKGROUND

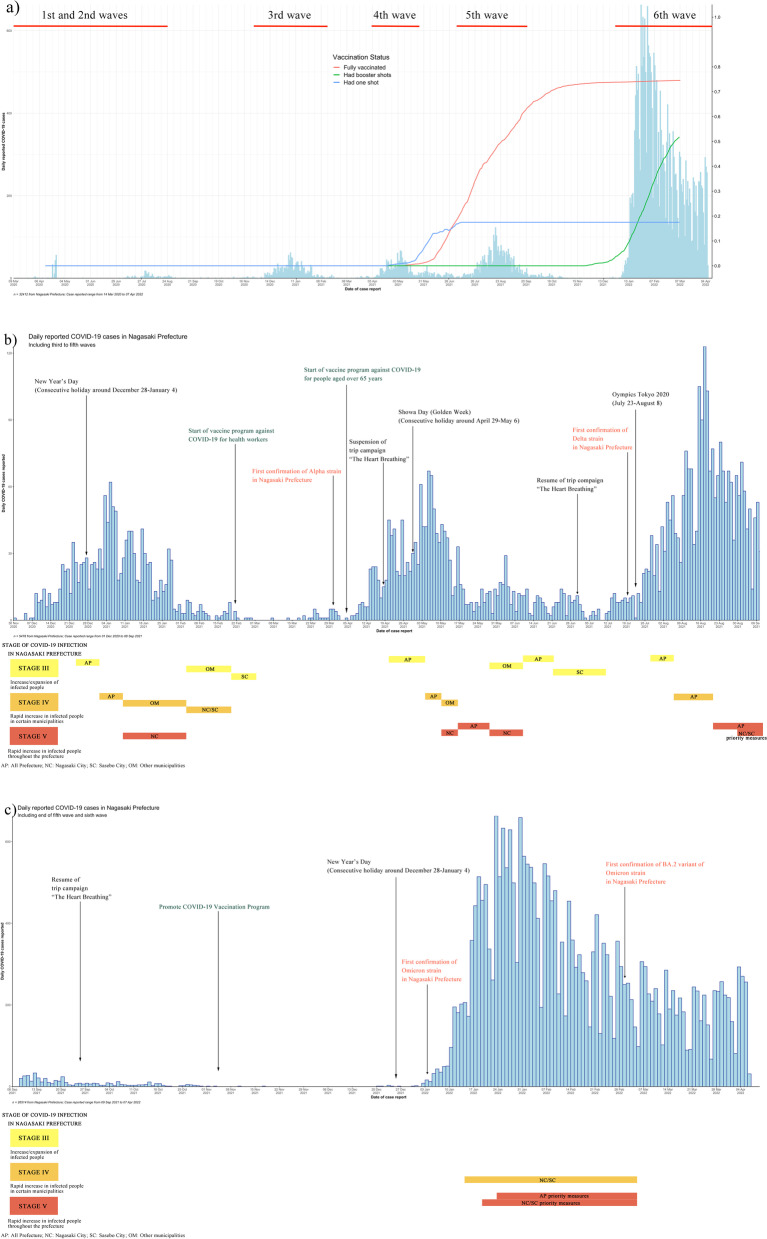
Up to April 2022, there were six waves of infection of coronavirus disease 2019 (COVID-19) in Japan. As the outbreaks continue to grow, it is critical to detect COVID-19's clusters to allocate health resources and improve decision-making substantially. This study aimed to identify active clusters of COVID-19 in Nagasaki Prefecture and form the spatiotemporal pattern of high-risk areas in different infection periods.

METHODS

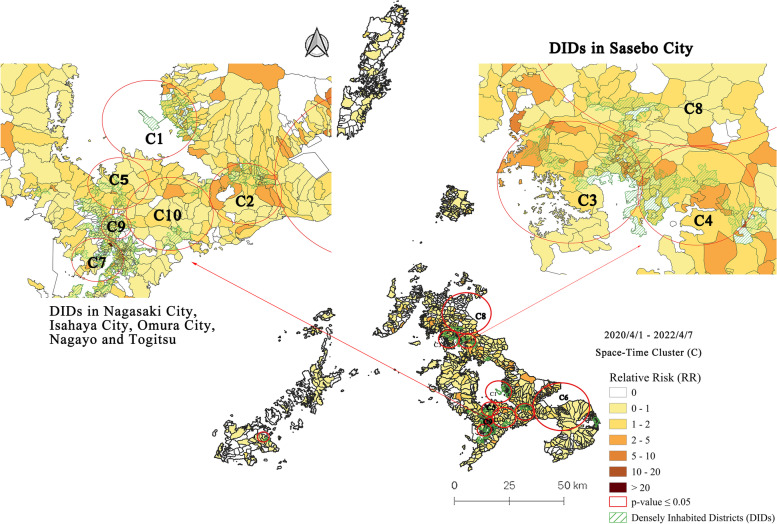
We used the prospective space-time scan statistic to detect emerging COVID-19 clusters and examine the relative risk in five consecutive periods from April 1, 2020 to April 7, 2022, in Nagasaki Prefecture.

RESULTS

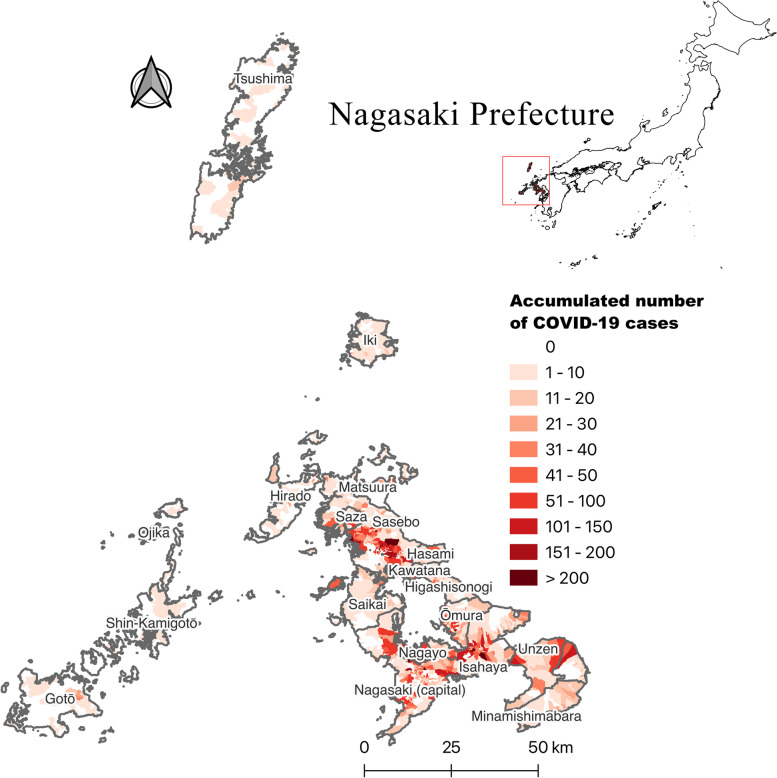
The densely inhabited districts (DIDs) in Nagasaki City have remained the most affected areas since December 2020. Most of the confirmed cases in the early period of each wave had a history of travelling to other prefectures. Community-level transmissions are suggested by the quick expansion of spatial clusters from urban areas to rural areas and remote islands. Moreover, outbreaks in welfare facilities and schools may lead to an emerging cluster in Nagasaki Prefecture's rural areas.

CONCLUSIONS

This study gives an overall analysis of the transmission dynamics of the COVID-19 pandemic in Nagasaki Prefecture, based on the number of machi-level daily cases. Furthermore, the findings in different waves can serve as references for subsequent pandemic prevention and control. This method helps the health authorities track and investigate outbreaks of COVID-19 that are specific to these environments, especially in rural areas where healthcare resources are scarce.

摘要

背景

截至2022年4月,日本已出现六波新型冠状病毒肺炎(COVID-19)感染疫情。随着疫情持续蔓延,检测COVID-19聚集性疫情对于合理分配卫生资源并大幅改善决策至关重要。本研究旨在确定长崎县COVID-19的活跃聚集性疫情,并形成不同感染时期高危地区的时空模式。

方法

我们使用前瞻性时空扫描统计方法,对长崎县2020年4月1日至2022年4月7日连续五个时期内新出现的COVID-19聚集性疫情进行检测,并分析相对风险。

结果

自2020年12月以来,长崎市的人口密集区一直是受影响最严重的地区。每波疫情早期的大多数确诊病例都有前往其他县的旅行史。空间聚集性疫情从城市地区迅速蔓延至农村地区和偏远岛屿,提示存在社区层面的传播。此外,福利设施和学校的疫情可能导致长崎县农村地区出现新的聚集性疫情。

结论

本研究基于町级每日病例数,对长崎县COVID-19疫情的传播动态进行了全面分析。此外,不同波次的研究结果可为后续疫情防控提供参考。该方法有助于卫生部门追踪和调查特定环境下的COVID-19疫情,尤其是在医疗资源稀缺的农村地区。

https://cdn.ncbi.nlm.nih.gov/pmc/blobs/e735/9317234/1a3596a8f3db/13690_2022_921_Fig7_HTML.jpg
https://cdn.ncbi.nlm.nih.gov/pmc/blobs/e735/9317234/c307f0efdee2/13690_2022_921_Fig1_HTML.jpg
https://cdn.ncbi.nlm.nih.gov/pmc/blobs/e735/9317234/f069e574e270/13690_2022_921_Fig2_HTML.jpg
https://cdn.ncbi.nlm.nih.gov/pmc/blobs/e735/9317234/7d742e08198d/13690_2022_921_Fig3_HTML.jpg
https://cdn.ncbi.nlm.nih.gov/pmc/blobs/e735/9317234/b9a23b25bded/13690_2022_921_Fig4_HTML.jpg
https://cdn.ncbi.nlm.nih.gov/pmc/blobs/e735/9317234/ca795a5b84da/13690_2022_921_Fig5_HTML.jpg
https://cdn.ncbi.nlm.nih.gov/pmc/blobs/e735/9317234/6552374c05b8/13690_2022_921_Fig6_HTML.jpg
https://cdn.ncbi.nlm.nih.gov/pmc/blobs/e735/9317234/1a3596a8f3db/13690_2022_921_Fig7_HTML.jpg

相似文献

1
Exploring spatiotemporal patterns of COVID-19 infection in Nagasaki Prefecture in Japan using prospective space-time scan statistics from April 2020 to April 2022.利用2020年4月至2022年4月的前瞻性时空扫描统计数据,探索日本长崎县新冠病毒感染的时空模式。
Arch Public Health. 2022 Jul 26;80(1):176. doi: 10.1186/s13690-022-00921-3.
2
Rapid surveillance of COVID-19 in the United States using a prospective space-time scan statistic: Detecting and evaluating emerging clusters.使用前瞻性时空扫描统计方法对美国新冠病毒病进行快速监测:检测和评估新出现的聚集性疫情。
Appl Geogr. 2020 May;118:102202. doi: 10.1016/j.apgeog.2020.102202. Epub 2020 Apr 8.
3
Monitoring European data with prospective space-time scan statistics: predicting and evaluating emerging clusters of COVID-19 in European countries.利用前瞻性时空扫描统计监测欧洲数据:预测和评估欧洲国家 COVID-19 新出现的集群。
BMC Public Health. 2022 Nov 25;22(1):2183. doi: 10.1186/s12889-022-14298-z.
4
A comparison of prospective space-time scan statistics and spatiotemporal event sequence based clustering for COVID-19 surveillance.用于新冠病毒疾病监测的前瞻性时空扫描统计与基于时空事件序列聚类的比较
PLoS One. 2021 Jun 10;16(6):e0252990. doi: 10.1371/journal.pone.0252990. eCollection 2021.
5
Utilizing prospective space-time scan statistics to discover the dynamics of coronavirus disease 2019 clusters in the State of São Paulo, Brazil.利用时空前瞻性扫描统计方法发现巴西圣保罗州 2019 年冠状病毒病聚集性的动态变化。
Rev Soc Bras Med Trop. 2022 Aug 5;55:e0607. doi: 10.1590/0037-8682-0607-2021. eCollection 2022.
6
Detection of space-time clusters using a topological hierarchy for geospatial data on COVID-19 in Japan.利用拓扑层次结构检测日本新冠肺炎地理空间数据的时空聚类。
Jpn J Stat Data Sci. 2022;5(1):279-301. doi: 10.1007/s42081-022-00159-x. Epub 2022 May 12.
7
Investigating Linkages Between Spatiotemporal Patterns of the COVID-19 Delta Variant and Public Health Interventions in Southeast Asia: Prospective Space-Time Scan Statistical Analysis Method.调查 COVID-19 德尔塔变异株时空模式与东南亚公共卫生干预措施之间的关联:前瞻性时空扫描统计分析方法。
JMIR Public Health Surveill. 2022 Aug 9;8(8):e35840. doi: 10.2196/35840.
8
[Spatial analysis for detecting clusters of cases during the COVID-19 emergency in Rome and in the Lazio Region (Central Italy)].[意大利中部罗马及拉齐奥大区新冠疫情紧急状态期间病例聚集性的空间分析]
Epidemiol Prev. 2020 Sep-Dec;44(5-6 Suppl 2):144-151. doi: 10.19191/EP20.5-6.S2.113.
9
Real time surveillance of COVID-19 space and time clusters during the summer 2020 in Spain.2020 年夏季西班牙 COVID-19 时空聚集的实时监测。
BMC Public Health. 2021 May 21;21(1):961. doi: 10.1186/s12889-021-10961-z.
10
Investigation of multi-scale spatio-temporal pattern of oldest-old clusters in China on the basis of spatial scan statistics.基于空间扫描统计的中国超高龄老年人群体多尺度时空格局研究。
PLoS One. 2019 Jul 26;14(7):e0219695. doi: 10.1371/journal.pone.0219695. eCollection 2019.

引用本文的文献

1
Spatial Distribution of COVID-19 Hospitalizations and Associated Risk Factors in Health Insurance Data Using Bayesian Spatial Modelling.利用贝叶斯空间模型在医疗保险数据中分析 COVID-19 住院患者的空间分布及其相关危险因素。
Int J Environ Res Public Health. 2023 Feb 28;20(5):4375. doi: 10.3390/ijerph20054375.

本文引用的文献

1
Properties of the Omicron Variant of SARS-CoV-2 Affect Public Health Measure Effectiveness in the COVID-19 Epidemic.奥密克戎变异株的特性影响 COVID-19 大流行中公共卫生措施的效果。
Int J Environ Res Public Health. 2022 Apr 19;19(9):4930. doi: 10.3390/ijerph19094930.
2
Waning COVID-19 vaccine effectiveness in Japan.日本 COVID-19 疫苗效力逐渐减弱。
Drug Discov Ther. 2022;16(1):30-36. doi: 10.5582/ddt.2022.01000.
3
Omicron severity: milder but not mild.奥密克戎毒株的严重程度:症状较轻但并非轻微。
Lancet. 2022 Jan 29;399(10323):412-413. doi: 10.1016/S0140-6736(22)00056-3. Epub 2022 Jan 19.
4
Epidemic versus economic performances of the COVID-19 lockdown: A big data driven analysis.新冠疫情封锁措施下的疫情表现与经济表现:基于大数据的分析
Cities. 2022 Jan;120:103502. doi: 10.1016/j.cities.2021.103502. Epub 2021 Oct 22.
5
Analysis of the Delta Variant B.1.617.2 COVID-19.新冠病毒Delta变异株B.1.617.2的分析
Clin Pract. 2021 Oct 21;11(4):778-784. doi: 10.3390/clinpract11040093.
6
COVID-19 vaccination intention and vaccine characteristics influencing vaccination acceptance: a global survey of 17 countries.COVID-19 疫苗接种意愿和影响疫苗接种接受度的疫苗特征:对 17 个国家的全球调查。
Infect Dis Poverty. 2021 Oct 7;10(1):122. doi: 10.1186/s40249-021-00900-w.
7
Simulating the impacts of interregional mobility restriction on the spatial spread of COVID-19 in Japan.模拟区域间流动限制对 COVID-19 在日本的空间传播的影响。
Sci Rep. 2021 Sep 23;11(1):18951. doi: 10.1038/s41598-021-97170-1.
8
Epidemiology of Coronavirus Disease Outbreak among Crewmembers on Cruise Ship, Nagasaki City, Japan, April 2020.2020 年 4 月,日本长崎市游轮船员中爆发的冠状病毒病的流行病学。
Emerg Infect Dis. 2021 Sep;27(9):2251-2260. doi: 10.3201/eid2709.204596.
9
COVID-19 case-clusters and transmission chains in the communities in Japan.日本社区中的新冠病毒病病例聚集情况和传播链。
J Infect. 2022 Feb;84(2):248-288. doi: 10.1016/j.jinf.2021.08.016. Epub 2021 Aug 11.
10
Japanese travel behavior trends and change under COVID-19 state-of-emergency declaration: Nationwide observation by mobile phone location data.新冠疫情紧急状态声明下日本的出行行为趋势与变化:基于手机定位数据的全国观测
Transp Res Interdiscip Perspect. 2021 Mar;9:100288. doi: 10.1016/j.trip.2020.100288. Epub 2020 Dec 26.