Stewart Robert, Erwin Samantha, Piburn Jesse, Nagle Nicholas, Kaufman Jason, Peluso Alina, Christian J Blair, Grant Joshua, Sorokine Alexandre, Bhaduri Budhendra
Oak Ridge National Laboratory (ORNL), 1 Bethel Valley RD, Bldg 5600, MS-6017, Oak Ridge, TN, 37830, USA.
Pacific Northwest National Laboratory (PNNL), 902 Battelle Blvd, Richland, WA, 99354, USA.
Appl Geogr. 2022 Sep;146:102759. doi: 10.1016/j.apgeog.2022.102759. Epub 2022 Aug 5.
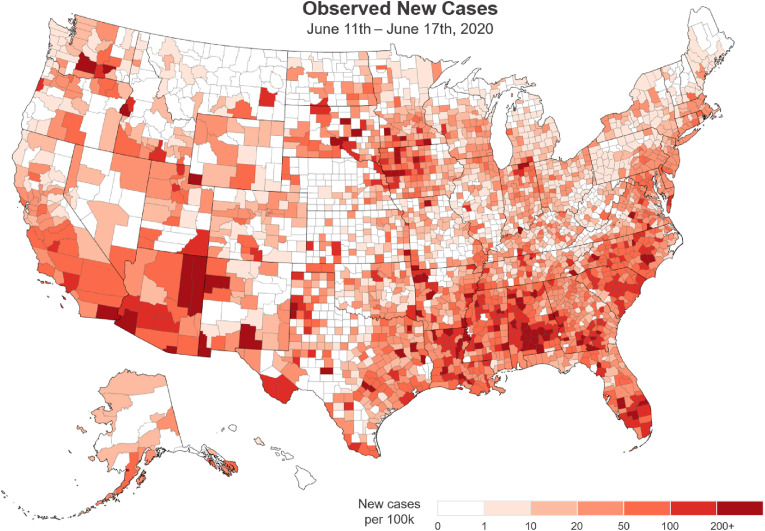
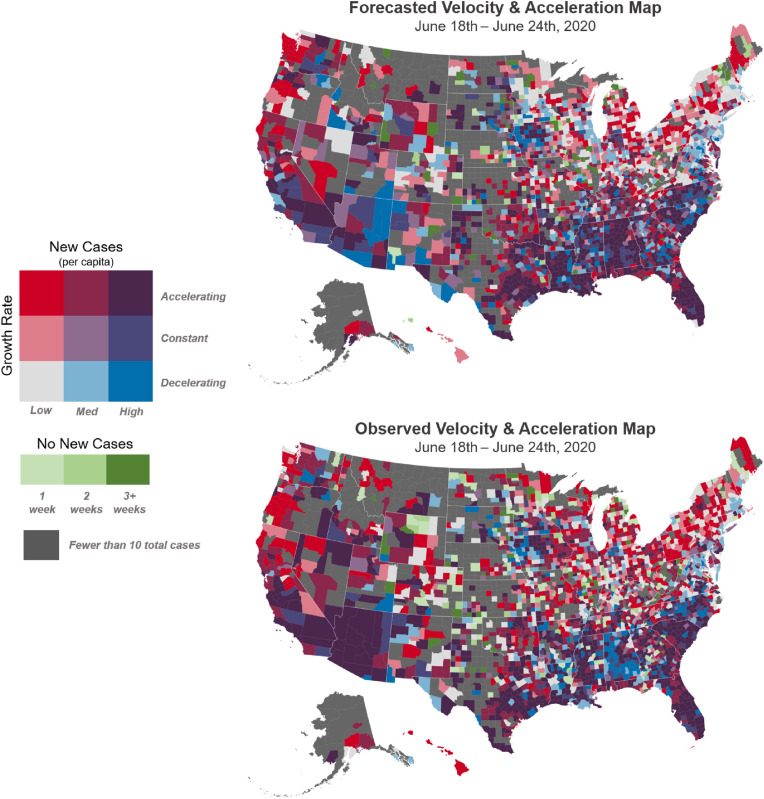
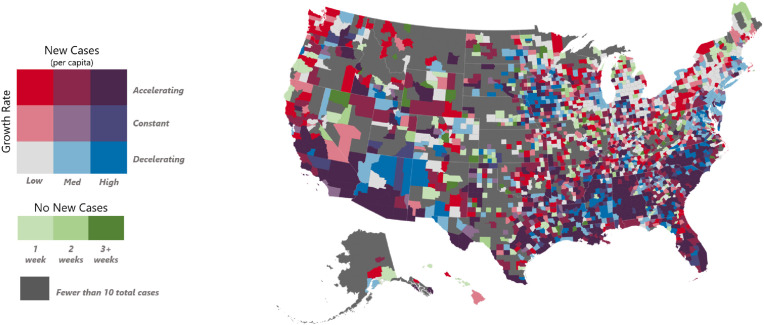
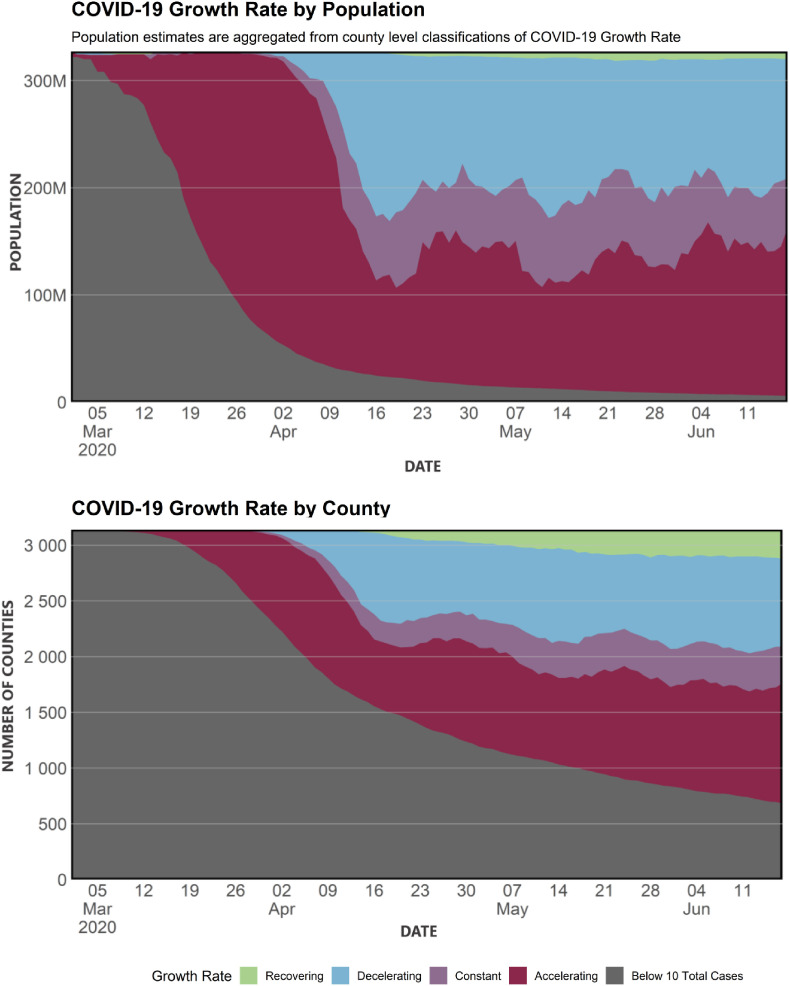
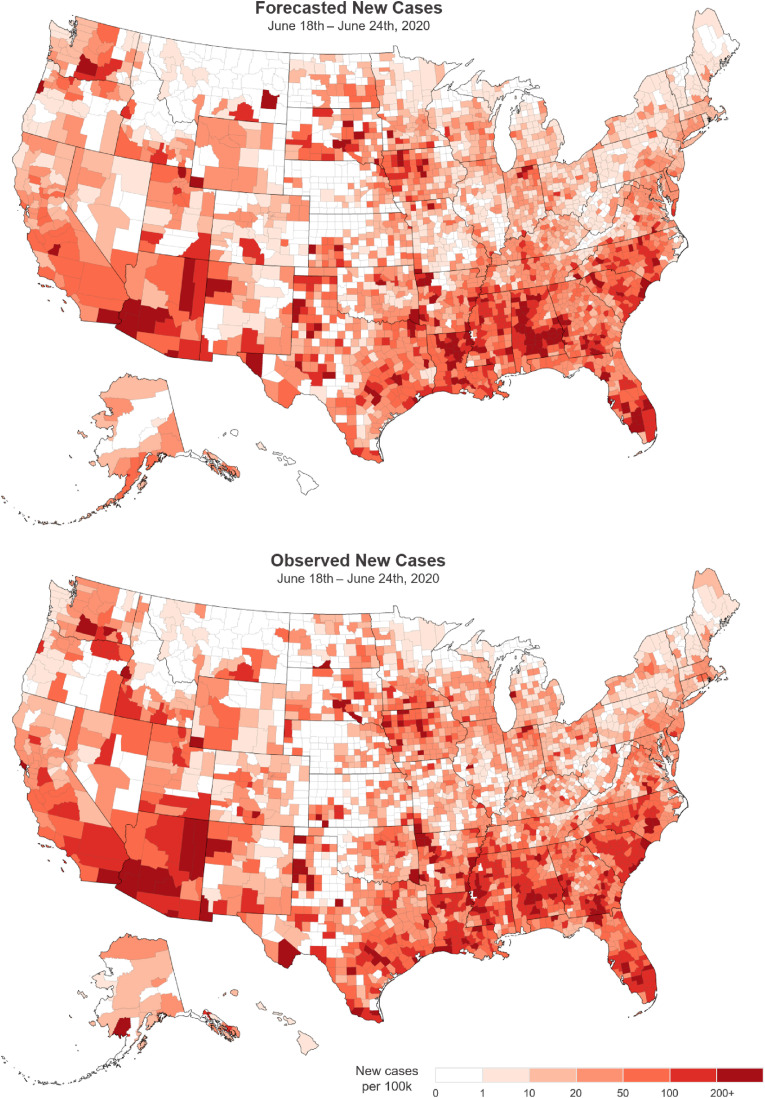
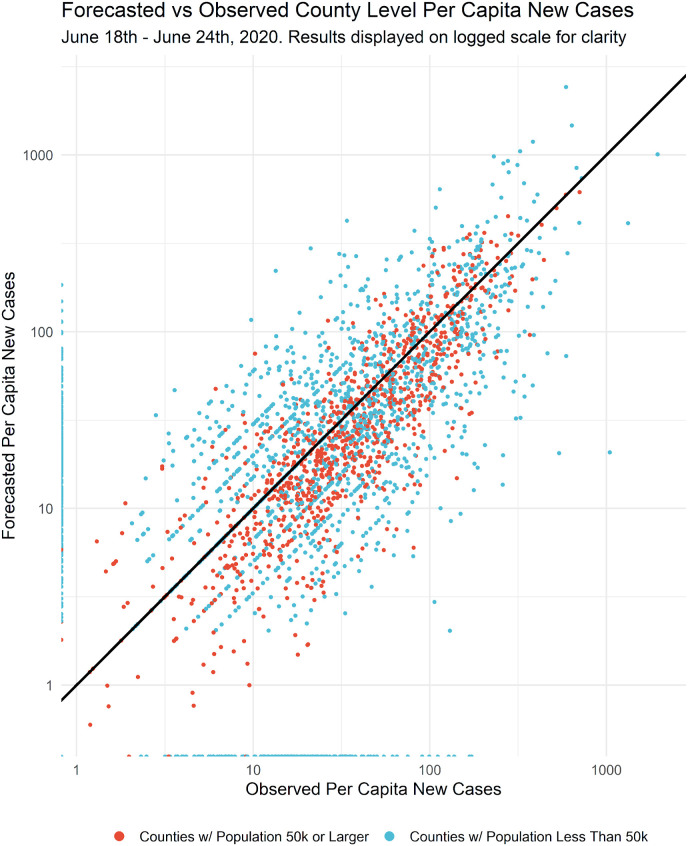
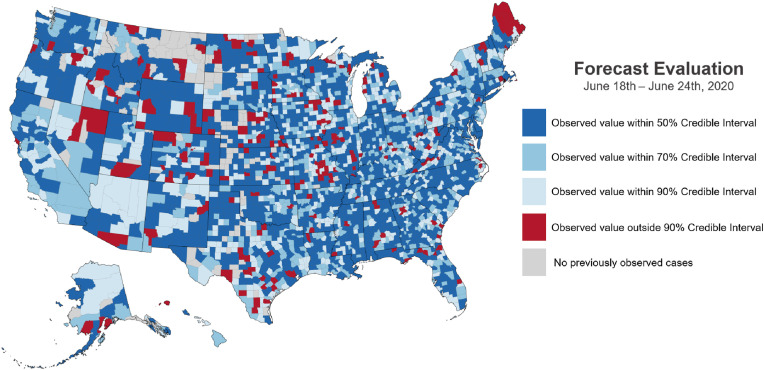
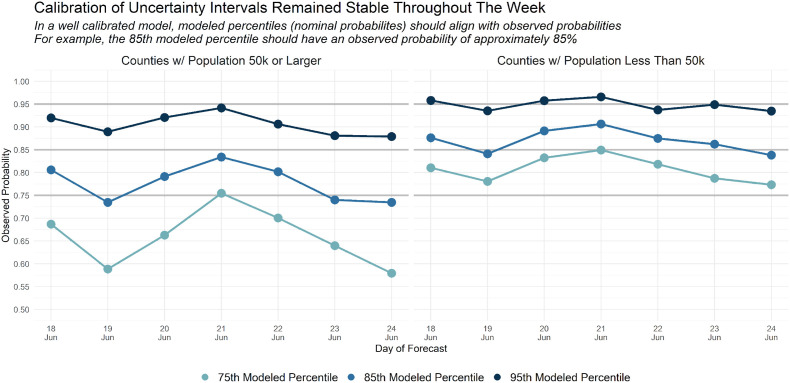
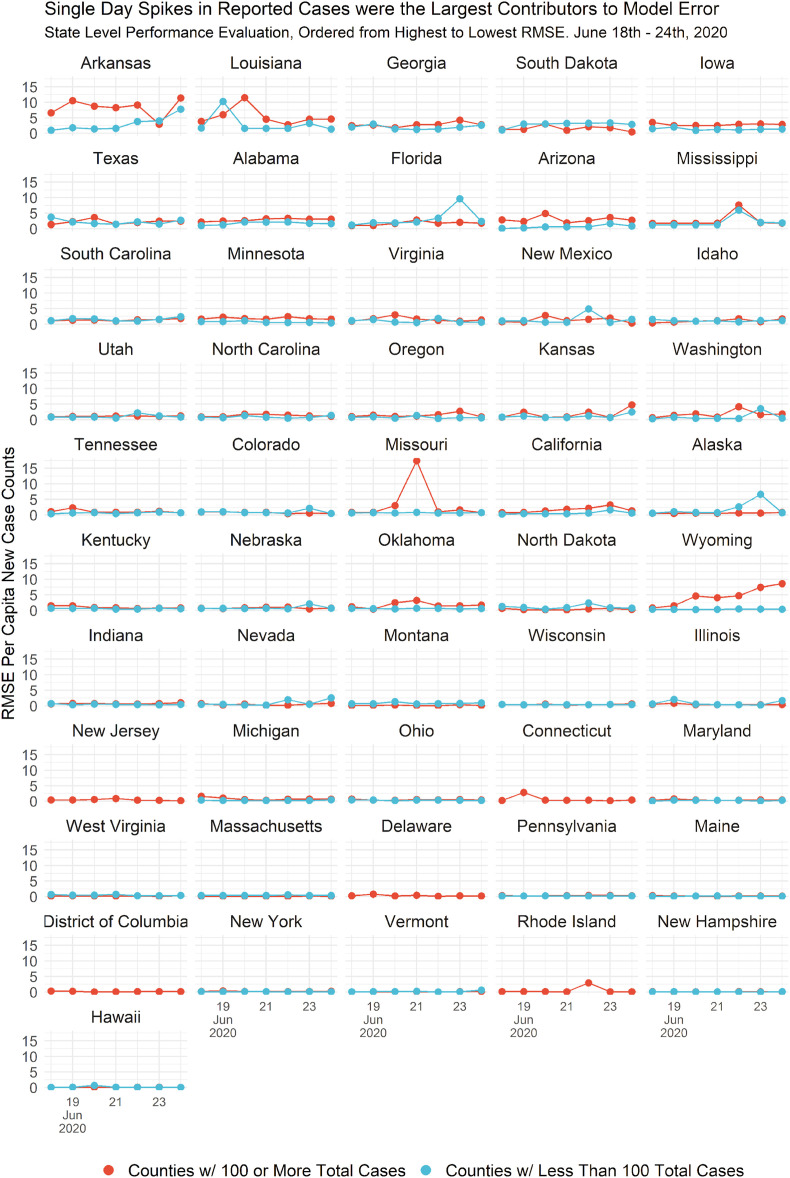
In the opening months of the pandemic, the need for situational awareness was urgent. Forecasting models such as the Susceptible-Infectious-Recovered (SIR) model were hampered by limited testing data and key information on mobility, contact tracing, and local policy variations would not be consistently available for months. New case counts from sources like John Hopkins University and the NY Times were systematically reliable. Using these data, we developed the novel COVID County Situational Awareness Tool (CCSAT) for reliable monitoring and decision support. In CCSAT, we developed a retrospective seven-day moving window semantic map of county-level disease magnitude and acceleration that smoothed noisy daily variations. We also developed a novel Bayesian model that reliably forecasted county-level magnitude and acceleration for the upcoming week based on population and new case count data. Together these formed a robust operational update including county-level maps of new case rate changes, estimates of new cases in the upcoming week, and measures of model reliability. We found CCSAT provided stable, reliable estimates across the seven-day time window, with the greatest errors occurring in cases of anomalous, single day spikes. In this paper, we provide CCSAT details and apply it to a single week in June 2020.
在疫情爆发的最初几个月,对态势感知的需求迫在眉睫。诸如易感-感染-康复(SIR)模型等预测模型受到检测数据有限的阻碍,有关流动性、接触者追踪和地方政策差异的关键信息在数月内都无法持续获取。来自约翰·霍普金斯大学和《纽约时报》等来源的新增病例数在系统上是可靠的。利用这些数据,我们开发了新颖的新冠疫情县级态势感知工具(CCSAT),用于可靠的监测和决策支持。在CCSAT中,我们开发了一个回顾性的七天移动窗口语义地图,用于显示县级疾病规模和增速,该地图平滑了每日的噪声变化。我们还开发了一种新颖的贝叶斯模型,该模型基于人口和新增病例数数据可靠地预测未来一周的县级规模和增速。这些共同构成了一个强大的运行更新,包括新病例率变化的县级地图、未来一周新病例的估计数以及模型可靠性的度量。我们发现CCSAT在七天时间窗口内提供了稳定、可靠的估计,最大误差出现在异常的单日激增情况下。在本文中,我们提供了CCSAT的详细信息,并将其应用于2020年6月的单周情况。