• 文献检索
  • 文档翻译
  • 深度研究
  • 学术资讯
  • Suppr Zotero 插件Zotero 插件
  • 邀请有礼
  • 套餐&价格
  • 历史记录
应用&插件
Suppr Zotero 插件Zotero 插件浏览器插件Mac 客户端Windows 客户端微信小程序
定价
高级版会员购买积分包购买API积分包
服务
文献检索文档翻译深度研究API 文档MCP 服务
关于我们
关于 Suppr公司介绍联系我们用户协议隐私条款
关注我们

Suppr 超能文献

核心技术专利:CN118964589B侵权必究
粤ICP备2023148730 号-1Suppr @ 2026

文献检索

告别复杂PubMed语法,用中文像聊天一样搜索,搜遍4000万医学文献。AI智能推荐,让科研检索更轻松。

立即免费搜索

文件翻译

保留排版,准确专业,支持PDF/Word/PPT等文件格式,支持 12+语言互译。

免费翻译文档

深度研究

AI帮你快速写综述,25分钟生成高质量综述,智能提取关键信息,辅助科研写作。

立即免费体验

瑞典乌普萨拉郡 COVID-19 检测阳性的时空预测:一种比较方法。

Spatio-temporal predictions of COVID-19 test positivity in Uppsala County, Sweden: a comparative approach.

机构信息

Department of Information Technology, Uppsala University, P.O. Box 337, 751 05, Uppsala, Sweden.

Department of Medical Sciences, Molecular Epidemiology and Science for Life Laboratory, Uppsala University, 751 85, Uppsala, Sweden.

出版信息

Sci Rep. 2022 Sep 7;12(1):15176. doi: 10.1038/s41598-022-19155-y.

DOI:10.1038/s41598-022-19155-y
PMID:36071066
原文链接:https://pmc.ncbi.nlm.nih.gov/articles/PMC9450842/
Abstract

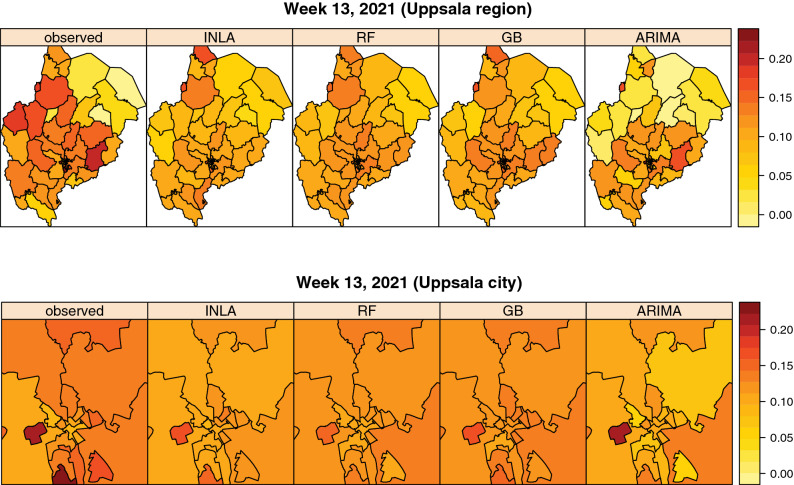
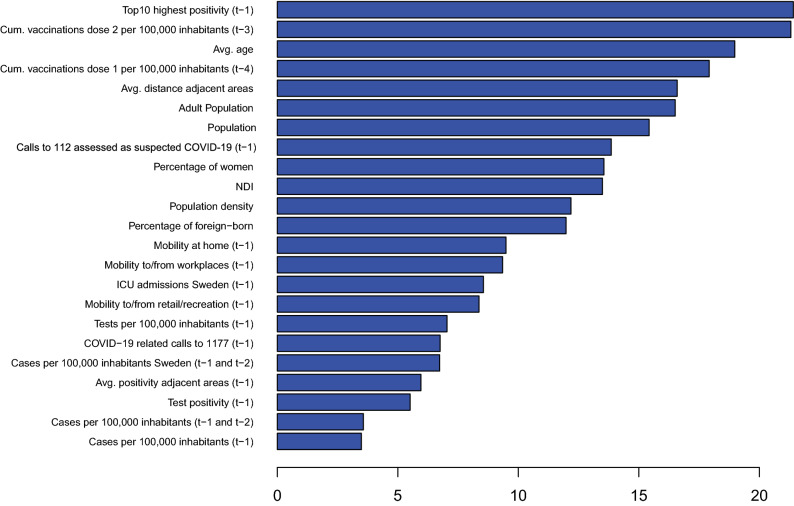
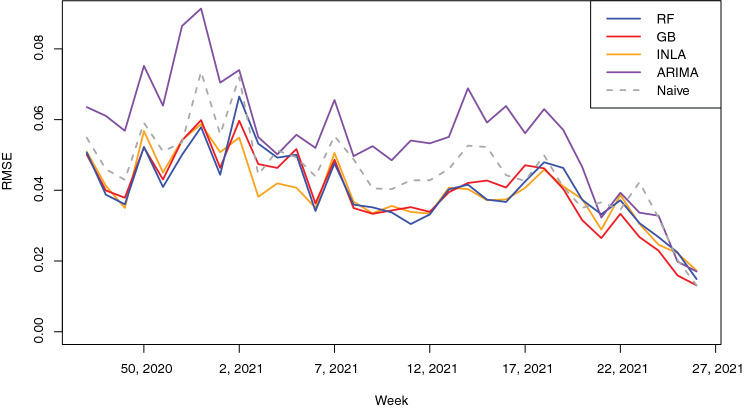
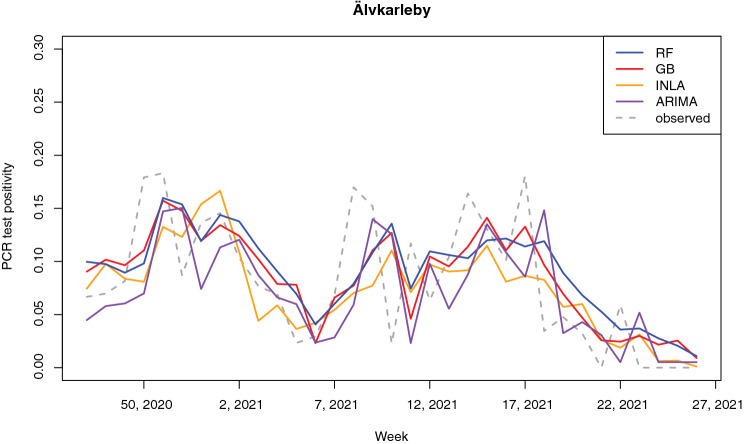
Previous spatio-temporal COVID-19 prediction models have focused on the prediction of subsequent number of cases, and have shown varying accuracy and lack of high geographical resolution. We aimed to predict trends in COVID-19 test positivity, an important marker for planning local testing capacity and accessibility. We included a full year of information (June 29, 2020-July 4, 2021) with both direct and indirect indicators of transmission, e.g. mobility data, number of calls to the national healthcare advice line and vaccination coverage from Uppsala County, Sweden, as potential predictors. We developed four models for a 1-week-window, based on gradient boosting (GB), random forest (RF), autoregressive integrated moving average (ARIMA) and integrated nested laplace approximations (INLA). Three of the models (GB, RF and INLA) outperformed the naïve baseline model after data from a full pandemic wave became available and demonstrated moderate accuracy. An ensemble model of these three models slightly improved the average root mean square error to 0.039 compared to 0.040 for GB, RF and INLA, 0.055 for ARIMA and 0.046 for the naïve model. Our findings indicate that the collection of a wide variety of data can contribute to spatio-temporal predictions of COVID-19 test positivity.

摘要

先前的 COVID-19 时空预测模型主要集中在对后续病例数量的预测上,其准确性和缺乏高地理分辨率的情况各不相同。我们旨在预测 COVID-19 检测阳性率的趋势,这是规划当地检测能力和可及性的重要指标。我们纳入了一整年的信息(2020 年 6 月 29 日-2021 年 7 月 4 日),包括直接和间接的传播指标,如流动性数据、国家医疗保健咨询热线的呼叫次数和瑞典乌普萨拉县的疫苗接种率,作为潜在的预测因素。我们针对一周的窗口期,基于梯度提升(GB)、随机森林(RF)、自回归综合移动平均(ARIMA)和集成嵌套拉普拉斯近似(INLA)开发了四个模型。在获得完整的大流行波数据后,除了基于简单平均的基线模型外,三种模型(GB、RF 和 INLA)表现优于其他模型,具有中等准确性。这三种模型的集成模型将平均均方根误差略微提高到 0.039,GB、RF 和 INLA 的平均均方根误差分别为 0.040、0.055 和 0.046。我们的研究结果表明,广泛收集各种数据可以有助于 COVID-19 检测阳性率的时空预测。

https://cdn.ncbi.nlm.nih.gov/pmc/blobs/e36e/9452547/1d3cf80f366f/41598_2022_19155_Fig7_HTML.jpg
https://cdn.ncbi.nlm.nih.gov/pmc/blobs/e36e/9452547/641cda4c5953/41598_2022_19155_Fig1_HTML.jpg
https://cdn.ncbi.nlm.nih.gov/pmc/blobs/e36e/9452547/16cc04d4a9c3/41598_2022_19155_Fig2_HTML.jpg
https://cdn.ncbi.nlm.nih.gov/pmc/blobs/e36e/9452547/25928d05480f/41598_2022_19155_Fig3_HTML.jpg
https://cdn.ncbi.nlm.nih.gov/pmc/blobs/e36e/9452547/0299d64db4c9/41598_2022_19155_Fig4_HTML.jpg
https://cdn.ncbi.nlm.nih.gov/pmc/blobs/e36e/9452547/23f3ff766941/41598_2022_19155_Fig5_HTML.jpg
https://cdn.ncbi.nlm.nih.gov/pmc/blobs/e36e/9452547/c6f5148c9247/41598_2022_19155_Fig6_HTML.jpg
https://cdn.ncbi.nlm.nih.gov/pmc/blobs/e36e/9452547/1d3cf80f366f/41598_2022_19155_Fig7_HTML.jpg

相似文献

1
Spatio-temporal predictions of COVID-19 test positivity in Uppsala County, Sweden: a comparative approach.瑞典乌普萨拉郡 COVID-19 检测阳性的时空预测:一种比较方法。
Sci Rep. 2022 Sep 7;12(1):15176. doi: 10.1038/s41598-022-19155-y.
2
Predicting COVID-19 hospitalizations: The importance of healthcare hotlines, test positivity rates and vaccination coverage.预测 COVID-19 住院人数:医疗热线、检测阳性率和疫苗接种覆盖率的重要性。
Spat Spatiotemporal Epidemiol. 2024 Feb;48:100636. doi: 10.1016/j.sste.2024.100636. Epub 2024 Jan 17.
3
Assessment of autoregressive integrated moving average (ARIMA), generalized linear autoregressive moving average (GLARMA), and random forest (RF) time series regression models for predicting influenza A virus frequency in swine in Ontario, Canada.评估自回归综合移动平均 (ARIMA)、广义线性自回归移动平均 (GLARMA) 和随机森林 (RF) 时间序列回归模型,以预测加拿大安大略省猪流感病毒的频率。
PLoS One. 2018 Jun 1;13(6):e0198313. doi: 10.1371/journal.pone.0198313. eCollection 2018.
4
Multi-Regional Modeling of Cumulative COVID-19 Cases Integrated with Environmental Forest Knowledge Estimation: A Deep Learning Ensemble Approach.基于环境森林知识估计的累积 COVID-19 病例的多区域建模:深度学习集成方法。
Int J Environ Res Public Health. 2022 Jan 10;19(2):738. doi: 10.3390/ijerph19020738.
5
Early detection of COVID-19 outbreaks using human mobility data.利用人口流动数据早期检测 COVID-19 疫情。
PLoS One. 2021 Jul 20;16(7):e0253865. doi: 10.1371/journal.pone.0253865. eCollection 2021.
6
Bayesian spatio-temporal analysis of the COVID-19 pandemic in Catalonia.贝叶斯时空分析加泰罗尼亚的 COVID-19 疫情。
Sci Rep. 2024 Feb 20;14(1):4220. doi: 10.1038/s41598-024-53527-w.
7
Sociodemographic characteristics and COVID-19 testing rates: spatiotemporal patterns and impact of test accessibility in Sweden.社会人口学特征与新冠病毒检测率:瑞典的时空模式及检测可及性的影响
Eur J Public Health. 2024 Feb 5;34(1):14-21. doi: 10.1093/eurpub/ckad209.
8
A COVID-19 Pandemic Artificial Intelligence-Based System With Deep Learning Forecasting and Automatic Statistical Data Acquisition: Development and Implementation Study.一种基于人工智能的新冠肺炎大流行深度学习预测与自动统计数据采集系统:开发与实施研究
J Med Internet Res. 2021 May 20;23(5):e27806. doi: 10.2196/27806.
9
Comparison of Predictive Models and Impact Assessment of Lockdown for COVID-19 over the United States.比较针对美国 COVID-19 的封锁的预测模型和影响评估。
J Epidemiol Glob Health. 2021 Jun;11(2):200-207. doi: 10.2991/jegh.k.210215.001. Epub 2021 Feb 22.
10
Estimation of malaria incidence in northern Namibia in 2009 using Bayesian conditional-autoregressive spatial-temporal models.2009年在纳米比亚北部运用贝叶斯条件自回归时空模型估算疟疾发病率。
Spat Spatiotemporal Epidemiol. 2013 Dec;7:25-36. doi: 10.1016/j.sste.2013.09.001. Epub 2013 Sep 17.

引用本文的文献

1
Spatial modelling of agro-ecologically significant grassland species using the INLA-SPDE approach.利用 INLA-SPDE 方法对具有农业生态意义的草原物种进行空间建模。
Sci Rep. 2023 Mar 27;13(1):4972. doi: 10.1038/s41598-023-32077-7.

本文引用的文献

1
SARS-CoV-2 wastewater surveillance data can predict hospitalizations and ICU admissions.污水监测数据可预测新冠病毒感染住院和 ICU 收治人数
Sci Total Environ. 2022 Jan 15;804:150151. doi: 10.1016/j.scitotenv.2021.150151. Epub 2021 Sep 7.
2
Comparison of ARIMA, ETS, NNAR, TBATS and hybrid models to forecast the second wave of COVID-19 hospitalizations in Italy.比较 ARIMA、ETS、NNAR、TBATS 和混合模型,以预测意大利第二波 COVID-19 住院人数。
Eur J Health Econ. 2022 Aug;23(6):917-940. doi: 10.1007/s10198-021-01347-4. Epub 2021 Aug 4.
3
Predictive performance of international COVID-19 mortality forecasting models.
国际 COVID-19 死亡率预测模型的预测性能。
Nat Commun. 2021 May 10;12(1):2609. doi: 10.1038/s41467-021-22457-w.
4
Trend Analysis and Forecasting the Spread of COVID-19 Pandemic in Ethiopia Using Box-Jenkins Modeling Procedure.使用Box-Jenkins建模程序对埃塞俄比亚COVID-19大流行的传播进行趋势分析和预测
Int J Gen Med. 2021 Apr 21;14:1485-1498. doi: 10.2147/IJGM.S306250. eCollection 2021.
5
Covid-19 Dynamic Monitoring and Real-Time Spatio-Temporal Forecasting.Covid-19 动态监测与实时时空预测。
Front Public Health. 2021 Apr 8;9:641253. doi: 10.3389/fpubh.2021.641253. eCollection 2021.
6
Forecasting of COVID-19 using deep layer Recurrent Neural Networks (RNNs) with Gated Recurrent Units (GRUs) and Long Short-Term Memory (LSTM) cells.使用带有门控循环单元(GRU)和长短期记忆(LSTM)细胞的深层循环神经网络(RNN)对2019冠状病毒病(COVID-19)进行预测。
Chaos Solitons Fractals. 2021 May;146:110861. doi: 10.1016/j.chaos.2021.110861. Epub 2021 Mar 14.
7
Regional forecasting of COVID-19 caseload by non-parametric regression: a VAR epidemiological model.基于非参数回归的新冠病毒病例数区域预测:向量自回归流行病学模型
AIMS Public Health. 2021 Feb 1;8(1):124-136. doi: 10.3934/publichealth.2021010. eCollection 2021.
8
Prehospital identification of Covid-19: an observational study.院前新冠病毒(Covid-19)识别:一项观察性研究。
Scand J Trauma Resusc Emerg Med. 2021 Jan 6;29(1):3. doi: 10.1186/s13049-020-00826-6.
9
COVID-19: Forecasting confirmed cases and deaths with a simple time series model.新冠疫情:用简单时间序列模型预测确诊病例和死亡人数
Int J Forecast. 2022 Apr-Jun;38(2):439-452. doi: 10.1016/j.ijforecast.2020.11.010. Epub 2020 Dec 4.
10
Clustering and superspreading potential of SARS-CoV-2 infections in Hong Kong.香港 SARS-CoV-2 感染的聚类和超级传播潜力。
Nat Med. 2020 Nov;26(11):1714-1719. doi: 10.1038/s41591-020-1092-0. Epub 2020 Sep 17.