Division of Pediatric Pulmonology, Department of Pediatrics, College of Physicians and Surgeons, Columbia University, 3959 Broadway CHC-745, New York, NY 10032, United States.
Columbia University Vagelos College of Physicians and Surgeons, 630 W 168th St, New York, NY 10032, United States.
Environ Int. 2022 Nov;169:107551. doi: 10.1016/j.envint.2022.107551. Epub 2022 Sep 27.
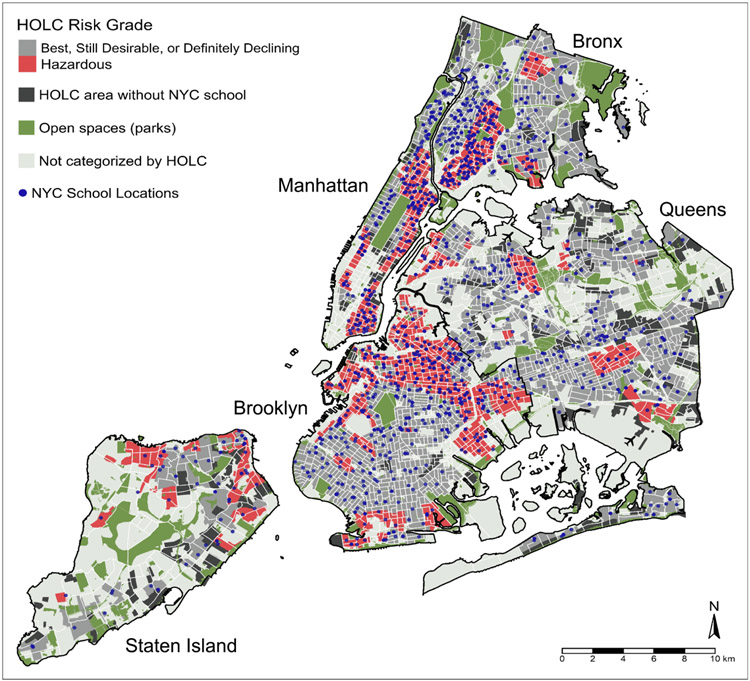
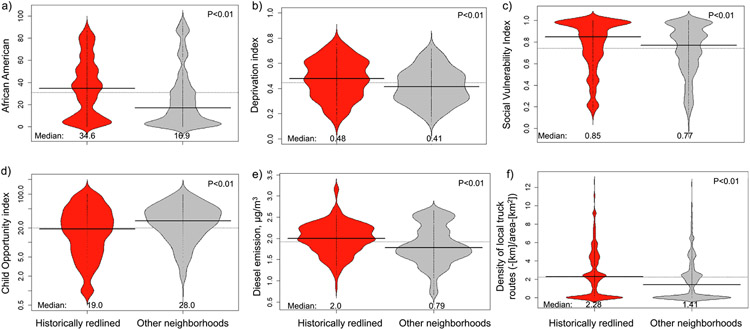
In the 1930's the United States (US) sponsored Home Owners' Loan Corporation (HOLC) created maps that determined risk for mortgage lending based on the racial and ethnic composition of neighborhoods leading to disinvestment in "redlined" or highest risk neighborhoods. This historical practice has perpetuated racial and economic segregation, and health disparities, that persist today. Interventions near schools where children spend large portions of the day, could impact large groups of children but schools are an often-overlooked environment for exposure. Despite a declining trend of ambient pollution in New York City (NYC) between 1998 and 2012, little is known about differences in air quality improvement near schools by historical redlining neighborhood status. Our objective was to examine if recent temporal trends of air pollution near NYC public schools differed in historically redlined neighborhoods.
We examined annual average street-level concentrations of combustion-related air pollutants (black carbon (BC), particulate matter (PM), nitrogen dioxide (NO), and nitric oxide (NO)), within a 250-m radius around schools using NYC Community Air Survey land-use regression models (n = 1,462). Year of monitoring, historical redlining (binary), and summer ozone were included in multivariable linear regression using generalized estimating equation models. Average annual percent change (APC) in pollutant concentration was calculated. Models were further stratified by historical redlining and a multiplicative interaction term (year of monitoring × historical redlining) was used to assess effect modification.
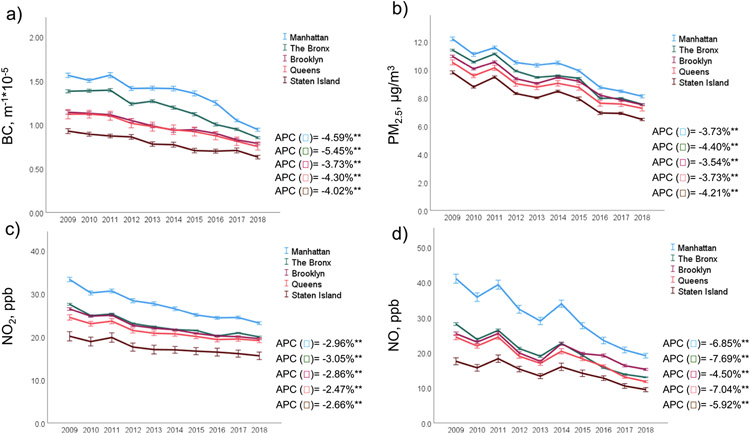
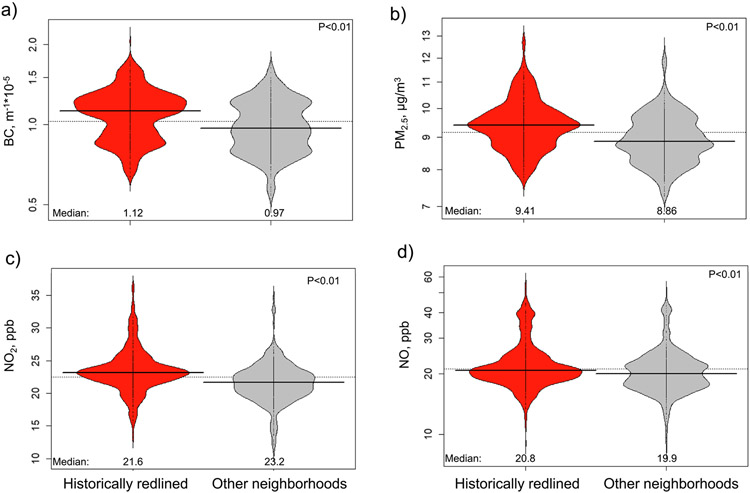
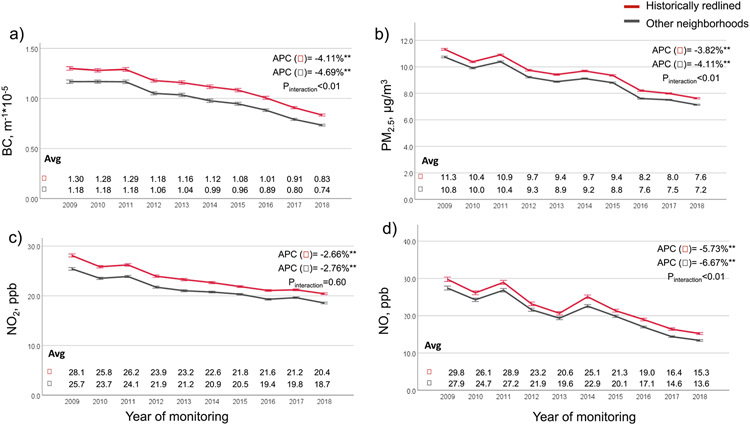
Overall, there was a decreasing trend of BC (APC = -4.40%), PM (-3.92%), NO (-2.76%), and NO (-6.20%) during the 10-year period. A smaller reduction of BC, PM and NO was observed in redlined neighborhoods (n = 722), compared to others (n = 740): BC (APC: -4.11% vs -4.69%; P < 0.01), PM (-3.82% vs -4.11%; P < 0.01), and NO (-5.73% vs -6.67%; P < 0.01). Temporal trends of NO did not differ by historical redlining (P = 0.60).
Despite significant reductions in annual average pollution concentrations across NYC, schools in historically redlined neighborhoods, compared to others, experienced smaller decrease in pollution, highlighting a potential ongoing ramification of the discriminatory practice.
20 世纪 30 年代,美国(US)赞助的房主贷款公司(HOLC)创建了地图,根据社区的种族和民族构成来确定抵押贷款风险,导致对“红线”或风险最高的社区进行撤资。这种历史上的做法延续了今天仍然存在的种族和经济隔离以及健康差距。在孩子们一天中大部分时间都在的学校附近进行干预,可以影响到大量的孩子,但学校往往是一个被忽视的暴露环境。尽管 1998 年至 2012 年间,纽约市(NYC)的环境污染物浓度呈下降趋势,但关于历史上的红线社区状况对学校附近空气质量改善的差异知之甚少。我们的目的是研究在历史上的红线社区,NYC 公立学校附近的空气污染是否存在近期的时间趋势差异。
我们使用纽约市社区空气调查土地利用回归模型,在学校周围 250 米半径内,检查了每年燃烧相关空气污染物(黑碳(BC)、颗粒物(PM)、二氧化氮(NO)和一氧化氮(NO))的街道水平浓度(n=1462)。在多变量线性回归中,使用广义估计方程模型,包括监测年份、历史红线(二进制)和夏季臭氧。计算污染物浓度的年平均百分比变化(APC)。模型进一步按历史红线划分,并使用乘法交互项(监测年份×历史红线)来评估效应修饰。
总的来说,在 10 年期间,BC(APC=-4.40%)、PM(APC=-3.92%)、NO(APC=-2.76%)和 NO(APC=-6.20%)的浓度呈下降趋势。在红线社区(n=722),与其他社区(n=740)相比,BC、PM 和 NO 的降幅较小:BC(APC:-4.11%对-4.69%;P<0.01)、PM(APC:-3.82%对-4.11%;P<0.01)和 NO(APC:-5.73%对-6.67%;P<0.01)。历史红线对 NO 的时间趋势没有影响(P=0.60)。
尽管纽约市的年平均污染浓度有显著降低,但与其他社区相比,历史上的红线社区的污染减少幅度较小,这突出了这种歧视性做法的潜在持续后果。