• 文献检索
  • 文档翻译
  • 深度研究
  • 学术资讯
  • Suppr Zotero 插件Zotero 插件
  • 邀请有礼
  • 套餐&价格
  • 历史记录
应用&插件
Suppr Zotero 插件Zotero 插件浏览器插件Mac 客户端Windows 客户端微信小程序
定价
高级版会员购买积分包购买API积分包
服务
文献检索文档翻译深度研究API 文档MCP 服务
关于我们
关于 Suppr公司介绍联系我们用户协议隐私条款
关注我们

Suppr 超能文献

核心技术专利:CN118964589B侵权必究
粤ICP备2023148730 号-1Suppr @ 2026

文献检索

告别复杂PubMed语法,用中文像聊天一样搜索,搜遍4000万医学文献。AI智能推荐,让科研检索更轻松。

立即免费搜索

文件翻译

保留排版,准确专业,支持PDF/Word/PPT等文件格式,支持 12+语言互译。

免费翻译文档

深度研究

AI帮你快速写综述,25分钟生成高质量综述,智能提取关键信息,辅助科研写作。

立即免费体验

ParcEMon:用于实时包裹级别最后一英里交付温室气体排放报告和管理的物联网平台。

ParcEMon: IoT Platform for Real-Time Parcel Level Last-Mile Delivery Greenhouse Gas Emissions Reporting and Management.

机构信息

School of Science, Computing and Engineering Technologies, Swinburne University of Technology, Melbourne, VIC 3122, Australia.

Institute of Railway Technology, Monash University, Melbourne, VIC 3800, Australia.

出版信息

Sensors (Basel). 2022 Sep 28;22(19):7380. doi: 10.3390/s22197380.

DOI:10.3390/s22197380
PMID:36236475
原文链接:https://pmc.ncbi.nlm.nih.gov/articles/PMC9570629/
Abstract

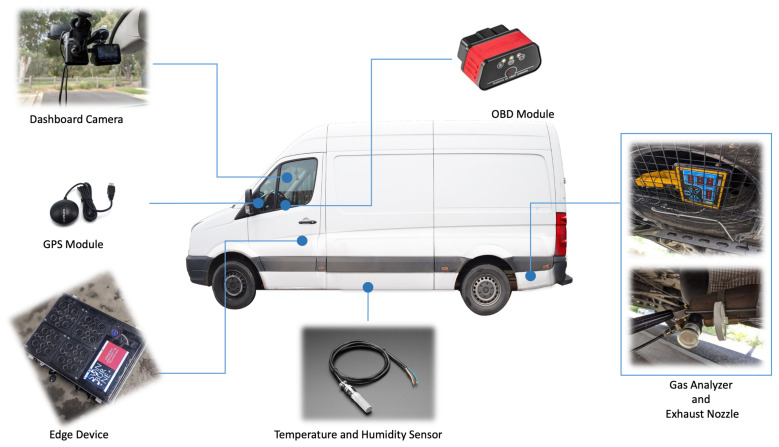
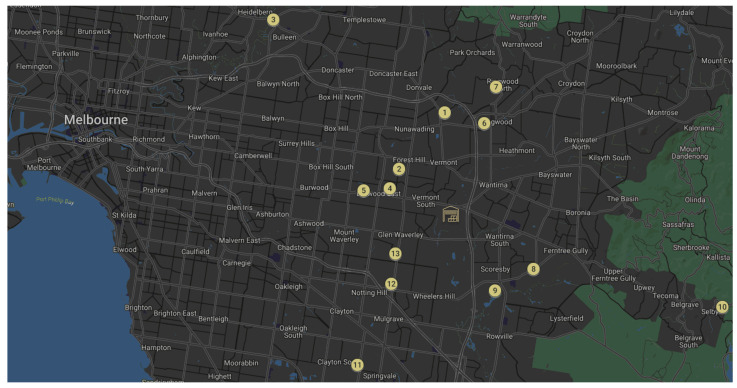
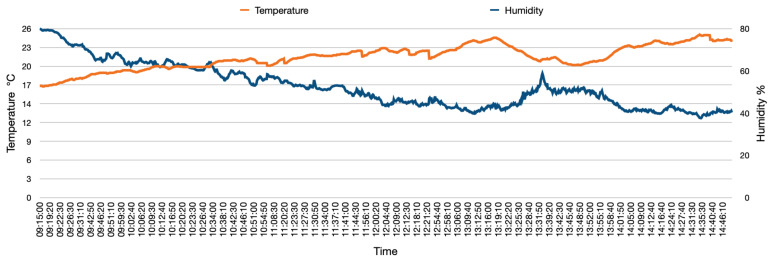
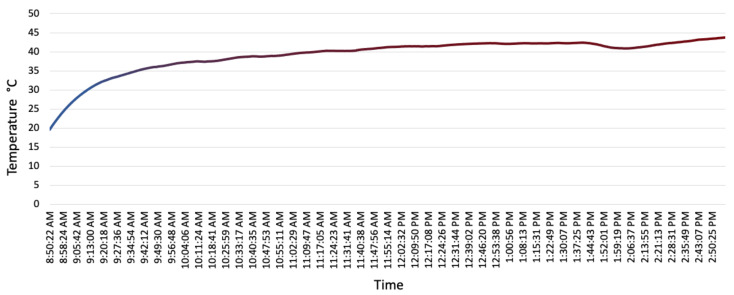
Transport is Australia's third-largest source of greenhouse gases accounting for around 17% of emissions. In recent times, and particularly as a result of the global pandemic, the rapid growth within the e-commerce sector has contributed to last-mile delivery becoming one of the main emission sources. Delivery vehicles operating at the last-mile travel long routes to deliver to customers an array of consignment parcels in varying numbers and weights, and therefore these vehicles play a major role in increasing emissions and air pollutants. The work reported in this paper aims to address these challenges by developing an IoT platform to measure and report on real-world last-mile delivery emissions. Such evaluations help to understand the factors contributing to freight emissions so that appropriate mitigation measures are implemented. Unlike previous research that was completed in controlled laboratory settings, the data collected in this research were from a delivery vehicle under real-world traffic and driving conditions. The IoT platform was tested to provide contextualised reporting by taking into account three main contexts including vehicle, environment and driving behaviours. This approach to data collection enabled the analysis of parcel level emissions and correlation of the vehicle characteristics, road conditions, ambient temperature and other environmental factors and driving behaviour that have an impact on emissions. The raw data collected from the sensors were analysed in real-time in the IoT platform, and the results showed a trade-off between parcel weight and total distance travelled which must be considered when selecting the best delivery order for reducing emissions. Overall, the study demonstrated the feasibility of the IoT platform in collecting the desired levels of data and providing detailed analysis of emissions at the parcel level. This type of micro-level understanding provides an important knowledge base for the enhancement of delivery processes and reduction of last-mile delivery emissions.

摘要

交通是澳大利亚温室气体排放的第三大来源,约占排放总量的 17%。近年来,特别是由于全球大流行,电子商务行业的快速增长导致最后一英里配送成为主要的排放源之一。最后一英里的配送车辆行驶长距离,为数以千计、重量各异的包裹向客户配送,因此这些车辆在增加排放和空气污染物方面发挥着重要作用。本文旨在通过开发物联网平台来测量和报告实际最后一英里配送排放,以应对这些挑战。这种评估有助于了解导致货运排放的因素,从而实施适当的缓解措施。与之前在受控实验室环境中完成的研究不同,本研究中收集的数据来自于实际交通和驾驶条件下的配送车辆。物联网平台经过测试,可以通过考虑车辆、环境和驾驶行为这三个主要方面提供情境化报告。这种数据收集方法能够分析包裹级别的排放,并对车辆特性、道路状况、环境温度等影响排放的因素以及驾驶行为进行相关分析。从传感器收集的原始数据在物联网平台中实时进行分析,结果表明在选择最佳配送顺序以减少排放时,必须考虑包裹重量和总行驶距离之间的权衡。总的来说,该研究展示了物联网平台在收集所需数据水平和提供包裹级排放详细分析方面的可行性。这种微观层面的理解为改进配送流程和减少最后一英里配送排放提供了重要的知识库。

https://cdn.ncbi.nlm.nih.gov/pmc/blobs/0dfe/9570629/a432efb110f9/sensors-22-07380-g015.jpg
https://cdn.ncbi.nlm.nih.gov/pmc/blobs/0dfe/9570629/ecae9fb80013/sensors-22-07380-g004.jpg
https://cdn.ncbi.nlm.nih.gov/pmc/blobs/0dfe/9570629/f1d9e6375488/sensors-22-07380-g001.jpg
https://cdn.ncbi.nlm.nih.gov/pmc/blobs/0dfe/9570629/49b20661c9c6/sensors-22-07380-g002.jpg
https://cdn.ncbi.nlm.nih.gov/pmc/blobs/0dfe/9570629/05204206e185/sensors-22-07380-g003.jpg
https://cdn.ncbi.nlm.nih.gov/pmc/blobs/0dfe/9570629/b1524e405af4/sensors-22-07380-g005.jpg
https://cdn.ncbi.nlm.nih.gov/pmc/blobs/0dfe/9570629/27c70a6203de/sensors-22-07380-g006.jpg
https://cdn.ncbi.nlm.nih.gov/pmc/blobs/0dfe/9570629/3e13d47c25dd/sensors-22-07380-g007.jpg
https://cdn.ncbi.nlm.nih.gov/pmc/blobs/0dfe/9570629/5f1970984915/sensors-22-07380-g008.jpg
https://cdn.ncbi.nlm.nih.gov/pmc/blobs/0dfe/9570629/4d97c89f35d4/sensors-22-07380-g009.jpg
https://cdn.ncbi.nlm.nih.gov/pmc/blobs/0dfe/9570629/2daa2beb8edd/sensors-22-07380-g010.jpg
https://cdn.ncbi.nlm.nih.gov/pmc/blobs/0dfe/9570629/fd14d68f1da5/sensors-22-07380-g011.jpg
https://cdn.ncbi.nlm.nih.gov/pmc/blobs/0dfe/9570629/096d7c19ed32/sensors-22-07380-g012.jpg
https://cdn.ncbi.nlm.nih.gov/pmc/blobs/0dfe/9570629/b1adde4ffe00/sensors-22-07380-g013.jpg
https://cdn.ncbi.nlm.nih.gov/pmc/blobs/0dfe/9570629/2fb5bb3799d5/sensors-22-07380-g014.jpg
https://cdn.ncbi.nlm.nih.gov/pmc/blobs/0dfe/9570629/a432efb110f9/sensors-22-07380-g015.jpg

相似文献

1
ParcEMon: IoT Platform for Real-Time Parcel Level Last-Mile Delivery Greenhouse Gas Emissions Reporting and Management.ParcEMon:用于实时包裹级别最后一英里交付温室气体排放报告和管理的物联网平台。
Sensors (Basel). 2022 Sep 28;22(19):7380. doi: 10.3390/s22197380.
2
Sensitivity Analysis of Emission Models of Parcel Lockers vs. Home Delivery Based on HBEFA.基于 HBEFA 的包裹储物柜与上门投递排放模型的灵敏度分析。
Int J Environ Res Public Health. 2021 Jun 11;18(12):6325. doi: 10.3390/ijerph18126325.
3
Development and application of an aerosol screening model for size-resolved urban aerosols.用于粒径分辨的城市气溶胶的气溶胶筛选模型的开发与应用。
Res Rep Health Eff Inst. 2014 Jun(179):3-79.
4
How to reduce the greenhouse gas emissions and air pollution caused by light and heavy duty vehicles with battery-electric, fuel cell-electric and catenary trucks.如何减少轻型和重型车辆的温室气体排放和空气污染,这些车辆包括电池电动汽车、燃料电池电动汽车和架空电车。
Environ Int. 2021 Jul;152:106474. doi: 10.1016/j.envint.2021.106474. Epub 2021 Mar 9.
5
Improving the assessment of RDE dynamics through vehicle-specific power analysis.通过车辆特定功率分析改善 RDE 动态评估。
Environ Sci Pollut Res Int. 2022 Aug;29(39):59561-59574. doi: 10.1007/s11356-022-19925-1. Epub 2022 Apr 7.
6
Life Cycle Greenhouse Gas Emissions for Last-Mile Parcel Delivery by Automated Vehicles and Robots.自动驾驶车辆和机器人进行最后一英里包裹配送的生命周期温室气体排放
Environ Sci Technol. 2021 Aug 17;55(16):11360-11367. doi: 10.1021/acs.est.0c08213. Epub 2021 Jul 30.
7
Developing and analyzing eco-driving strategies for on-road emission reduction in urban transport systems - A VR-enabled digital-twin approach.开发和分析城市交通系统中减少道路排放的生态驾驶策略——一种基于虚拟现实的数字孪生方法。
Chemosphere. 2022 Oct;305:135372. doi: 10.1016/j.chemosphere.2022.135372. Epub 2022 Jun 16.
8
Impacts of Autonomous Vehicles on Greenhouse Gas Emissions-Positive or Negative?自动驾驶汽车对温室气体排放的影响——是正面的还是负面的?
Int J Environ Res Public Health. 2021 May 23;18(11):5567. doi: 10.3390/ijerph18115567.
9
Greenhouse gas emission benefits of adopting new energy vehicles in Suzhou City, China: A case study.中国苏州市采用新能源汽车的温室气体排放效益:一项案例研究。
Environ Sci Pollut Res Int. 2022 Oct;29(50):76286-76297. doi: 10.1007/s11356-022-21284-w. Epub 2022 Jun 6.
10
Emissions from the road transport sector of New Zealand: key drivers and challenges.新西兰道路运输部门的排放:主要驱动因素和挑战。
Environ Sci Pollut Res Int. 2019 Aug;26(23):23937-23957. doi: 10.1007/s11356-019-05734-6. Epub 2019 Jun 20.

引用本文的文献

1
Hydrogen 4.0: A Cyber-Physical System for Renewable Hydrogen Energy Plants.氢能4.0:可再生氢能发电厂的信息物理系统
Sensors (Basel). 2024 May 20;24(10):3239. doi: 10.3390/s24103239.
2
End-to-End Solution for Analog Gauge Monitoring Using Computer Vision in an IoT Platform.物联网平台中使用计算机视觉的模拟仪表监测端到端解决方案。
Sensors (Basel). 2023 Dec 15;23(24):9858. doi: 10.3390/s23249858.
3
ArtEMon: Artificial Intelligence and Internet of Things Powered Greenhouse Gas Sensing for Real-Time Emissions Monitoring.ArtEMon:基于人工智能和物联网的温室气体传感,用于实时排放监测。

本文引用的文献

1
Life Cycle Greenhouse Gas Emissions for Last-Mile Parcel Delivery by Automated Vehicles and Robots.自动驾驶车辆和机器人进行最后一英里包裹配送的生命周期温室气体排放
Environ Sci Technol. 2021 Aug 17;55(16):11360-11367. doi: 10.1021/acs.est.0c08213. Epub 2021 Jul 30.
Sensors (Basel). 2023 Sep 19;23(18):7971. doi: 10.3390/s23187971.
4
Sazgar IoT: A Device-Centric IoT Framework and Approximation Technique for Efficient and Scalable IoT Data Processing.萨兹加尔物联网:一种以设备为中心的物联网框架及用于高效且可扩展的物联网数据处理的近似技术。
Sensors (Basel). 2023 May 30;23(11):5211. doi: 10.3390/s23115211.
5
Cyber-Physical-Social Awareness Platform for Comprehensive Situation Awareness.用于全面态势感知的网络物理社会意识平台。
Sensors (Basel). 2023 Jan 10;23(2):822. doi: 10.3390/s23020822.