Department of Anthropology, Northwestern University, 1819 Hinman Avenue, Evanston, Illinois, 60201 United States of America (USA).
Department of Health Promotion, Education, and Behavior, University of South Carolina, Columbia, USA.
Bull World Health Organ. 2023 Feb 1;101(2):90-101. doi: 10.2471/BLT.22.288771. Epub 2022 Dec 1.
To investigate how water and food insecurity were associated in nationally representative samples of individuals from 25 low- and middle-income countries.
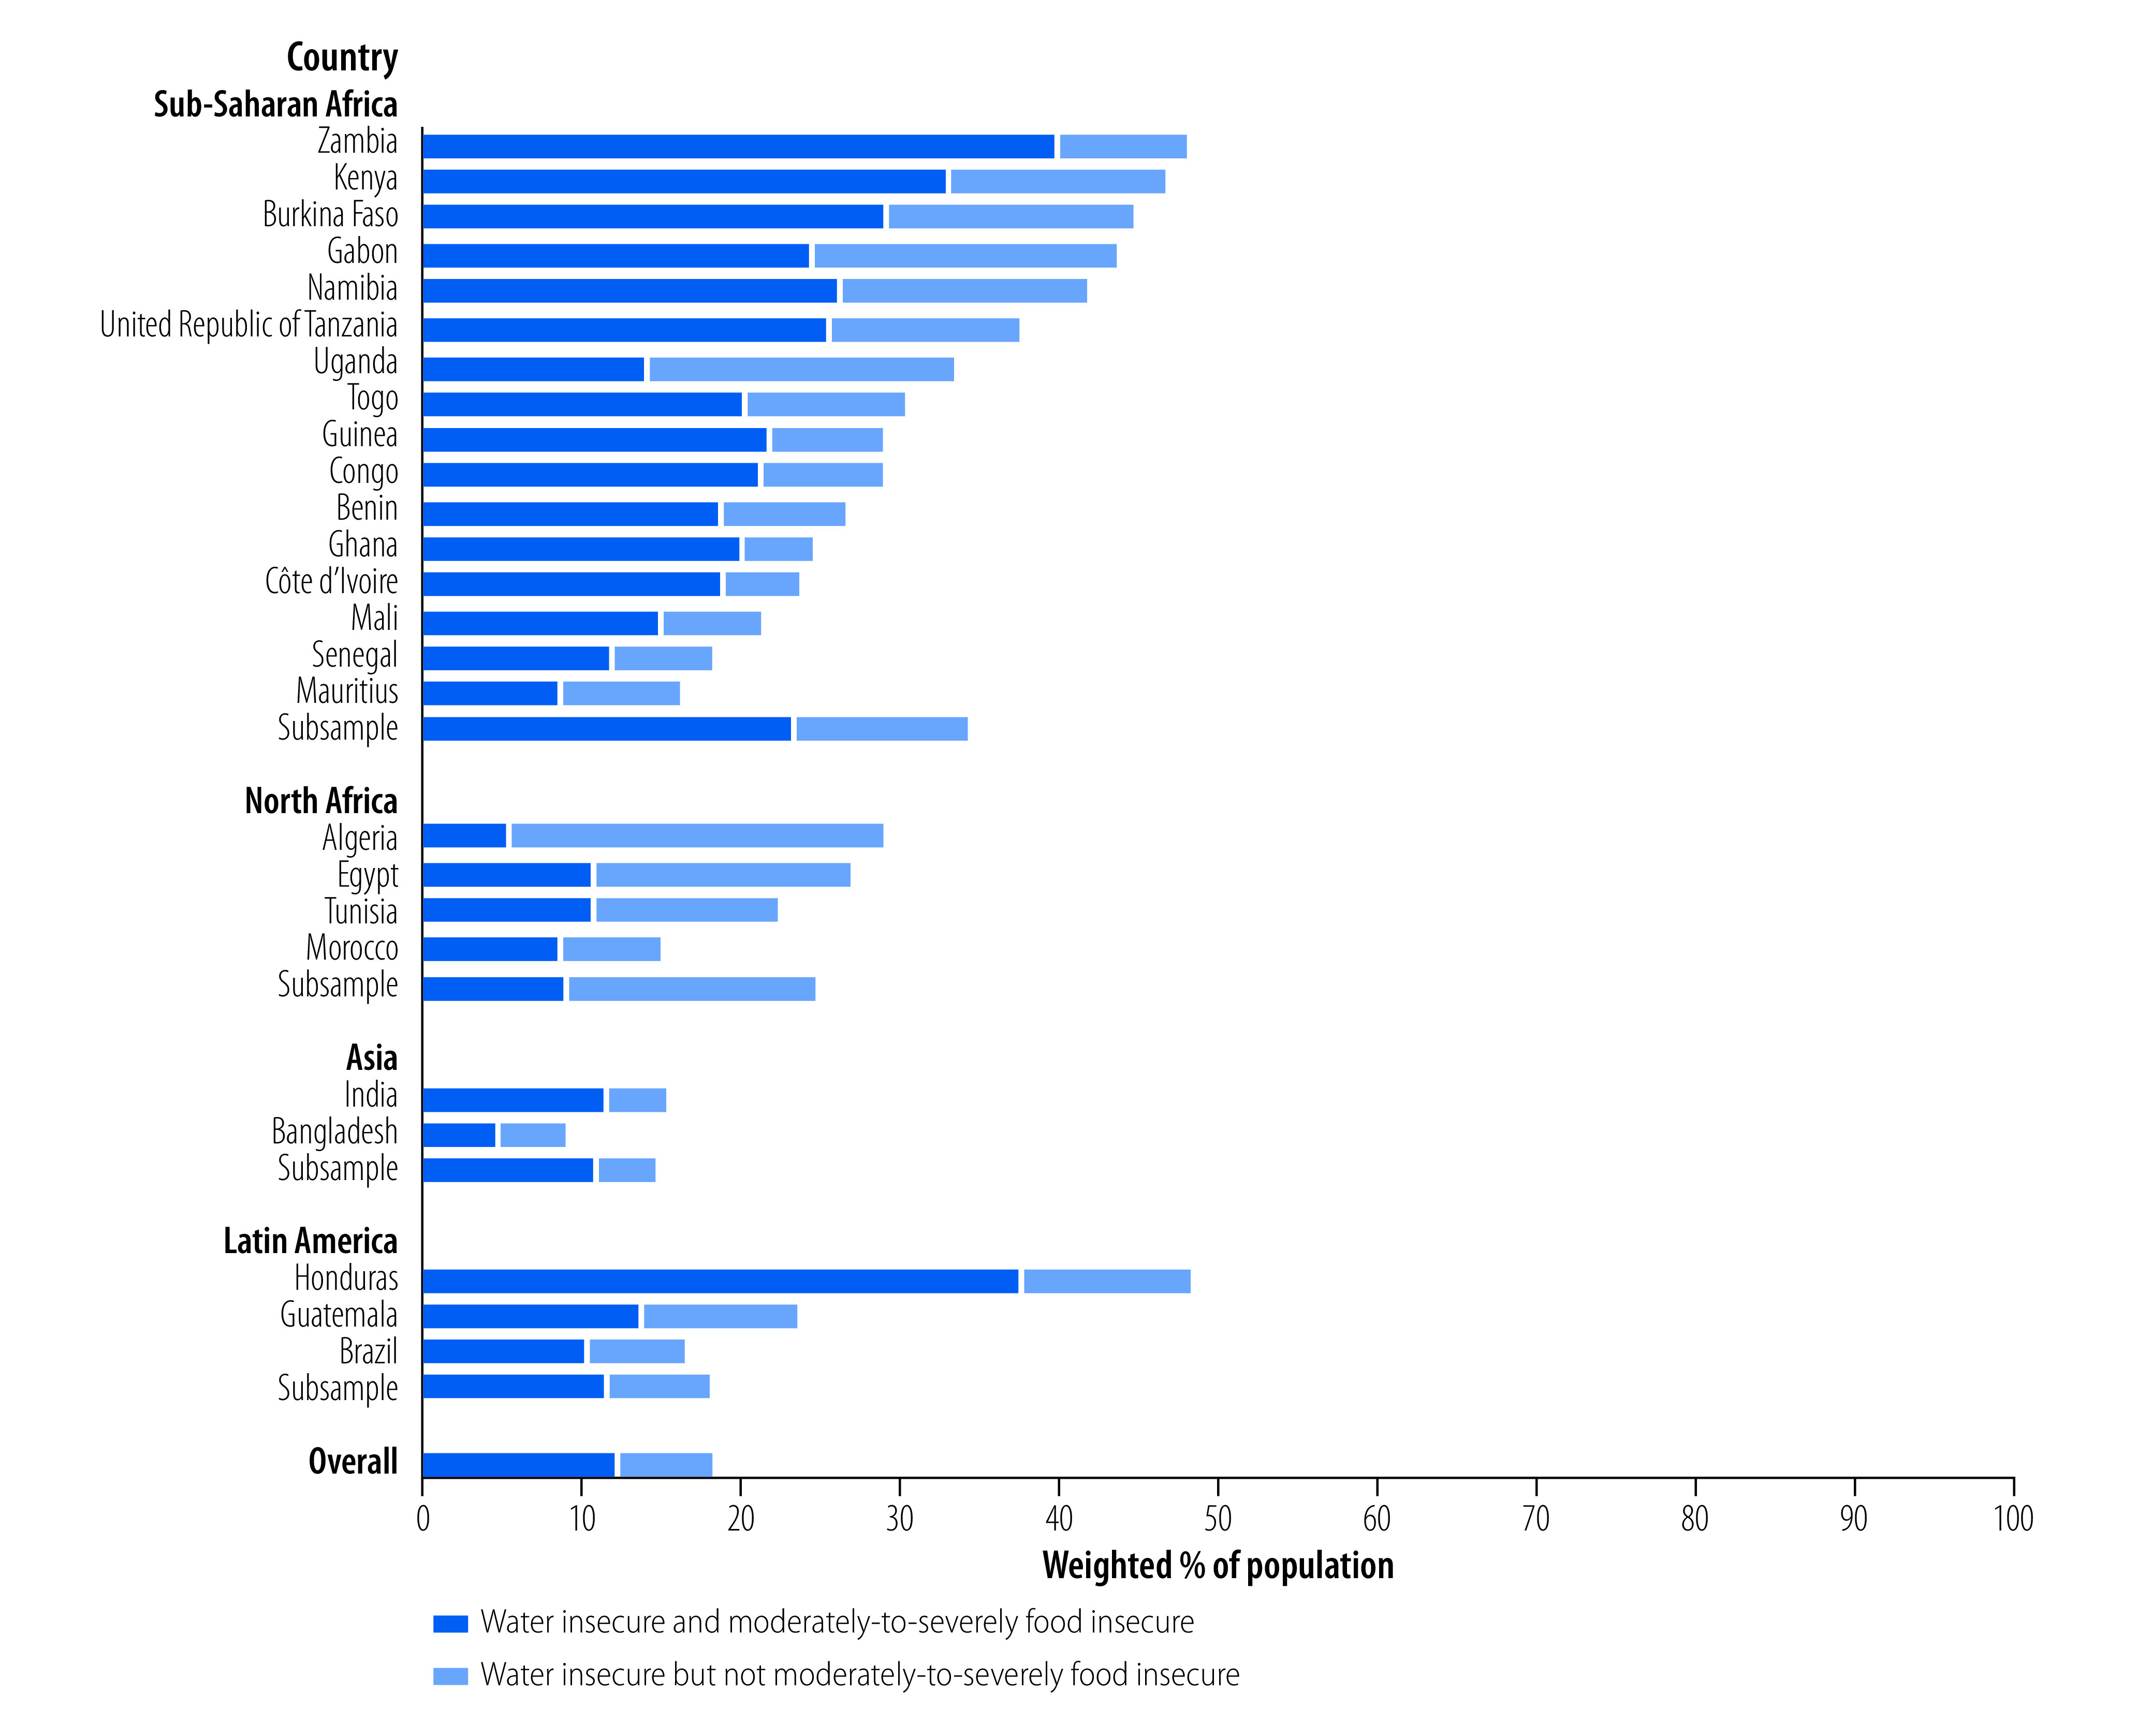
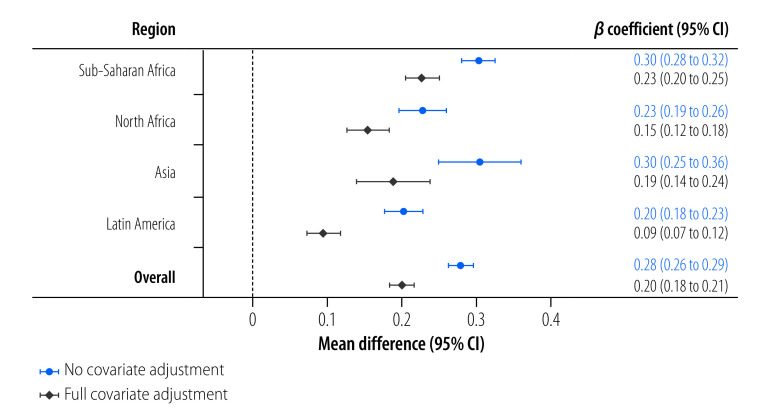
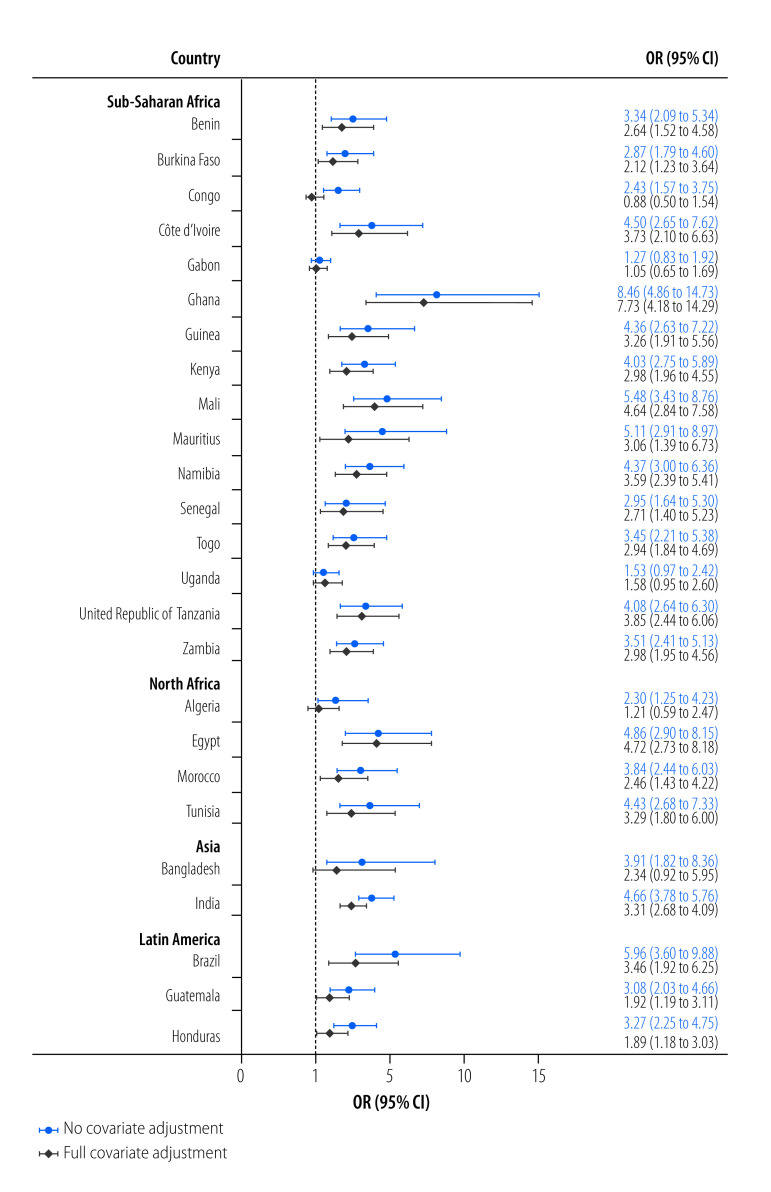
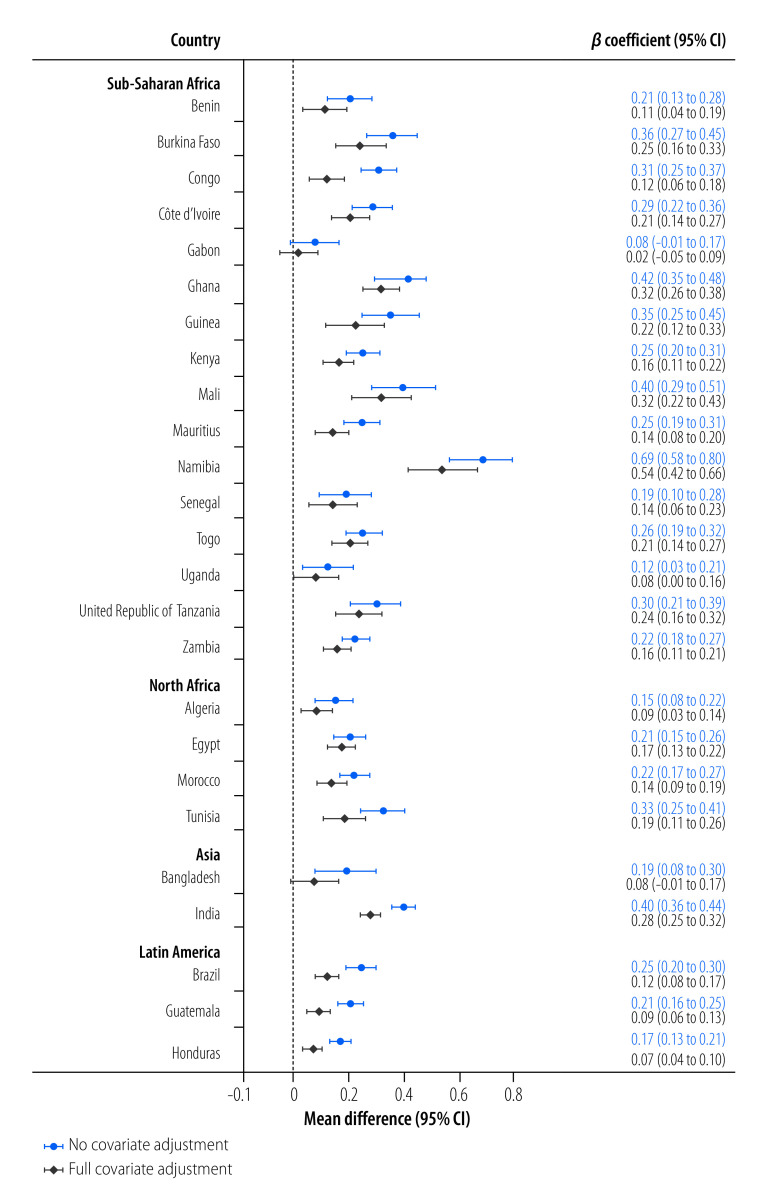
We used data from the 2020 World Gallup Poll in which the Individual Water Insecurity Experiences Scale and the Food Insecurity Experience Scale had been administered to 31 755 respondents. These scales measure insecurity experiences in the previous 12 months. We classified individuals as water insecure if their score was ≥ 12 and food insecure if the Rasch probability parameter was ≥ 0.5. For estimating the proportions, we used projection weights. We estimated the relationships between binary and continuous measures of water insecurity and food insecurity for individuals within each country and region using multivariable logistic and linear regression models, adjusting for key socioeconomic characteristics including income, gender, age and education.
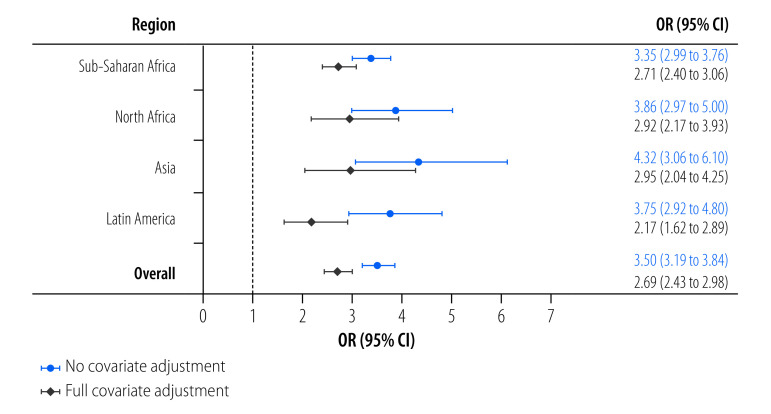
Among the 18.3% of respondents who experienced water insecurity, 66.8% also experienced food insecurity. The likelihood of experiencing moderate-to-severe food insecurity was higher among respondents also experiencing water insecurity (adjusted odds ratio, aOR: 2.69; 95% confidence interval, CI: 2.43 to 2.98). Similar odds were found in Asia (aOR: 2.95; 95% CI: 2.04 to 4.25), Latin America (aOR: 2.17; 95% CI: 1.62 to 2.89), North Africa (aOR: 2.92; 95% CI: 2.17 to 3.93) and sub-Saharan Africa (aOR: 2.71; 95% CI: 2.40 to 3.06).
Our results suggest that water insecurity should be considered when developing food and nutrition policies and interventions. However, more research is needed to understand the paths between these insecurities.
在来自 25 个低收入和中等收入国家的具有代表性的个体样本中,调查水不安全和粮食不安全之间的关联。
我们使用了 2020 年世界盖洛普民意调查的数据,该调查向 31755 名受访者使用个体水不安全经验量表和粮食不安全经验量表进行了调查。这些量表衡量了过去 12 个月的不安全体验。如果个体的分数≥12,则将其归类为水不安全;如果 Rasch 概率参数≥0.5,则将其归类为粮食不安全。为了估计比例,我们使用了预测权重。我们使用多变量逻辑回归和线性回归模型,根据包括收入、性别、年龄和教育在内的关键社会经济特征,调整了个体在每个国家和地区的二元和连续水不安全和粮食不安全测量之间的关系。
在经历水不安全的受访者中(占 18.3%),有 66.8%的受访者同时也经历了粮食不安全。在经历水不安全的受访者中,出现中度至重度粮食不安全的可能性更高(调整后的优势比,aOR:2.69;95%置信区间,CI:2.43 至 2.98)。在亚洲(aOR:2.95;95%CI:2.04 至 4.25)、拉丁美洲(aOR:2.17;95%CI:1.62 至 2.89)、北非(aOR:2.92;95%CI:2.17 至 3.93)和撒哈拉以南非洲(aOR:2.71;95%CI:2.40 至 3.06)也发现了类似的几率。
我们的结果表明,在制定粮食和营养政策和干预措施时,应考虑水不安全问题。然而,需要进一步研究来了解这两种不安全之间的关系。