Quantitative Data Analytics Group, Department of Computer Science, Faculty of Science, Vrije Universiteit, Amsterdam, the Netherlands.
Department of Intensive Care Medicine, Laboratory for Critical Care Computational Intelligence, Amsterdam Medical Data Science, Amsterdam UMC, Vrije Universiteit, Amsterdam, the Netherlands.
J Intensive Care Med. 2023 Jul;38(7):612-629. doi: 10.1177/08850666231153393. Epub 2023 Feb 6.
Identification of clinical phenotypes in critically ill COVID-19 patients could improve understanding of the disease heterogeneity and enable prognostic and predictive enrichment. However, previous attempts did not take into account temporal dynamics with high granularity. By including the dimension of time, we aim to gain further insights into the heterogeneity of COVID-19.
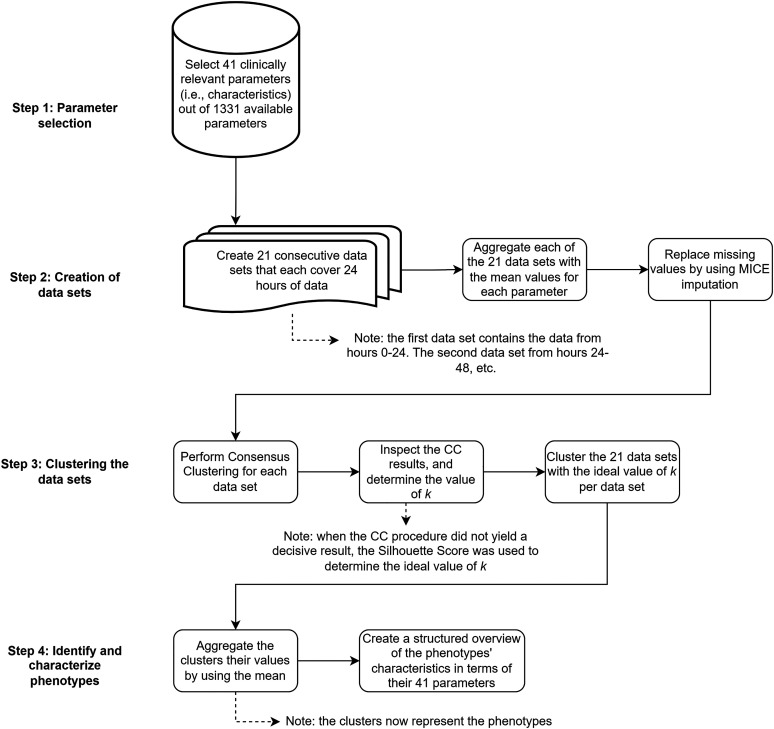
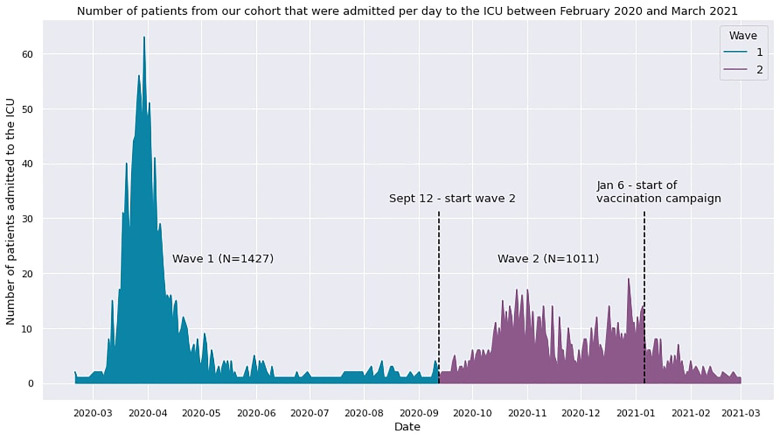
We used granular data from 3202 adult COVID patients in the Dutch Data Warehouse that were admitted to one of 25 Dutch ICUs between February 2020 and March 2021. Parameters including demographics, clinical observations, medications, laboratory values, vital signs, and data from life support devices were selected. Twenty-one datasets were created that each covered 24 h of ICU data for each day of ICU treatment. Clinical phenotypes in each dataset were identified by performing cluster analyses. Both evolution of the clinical phenotypes over time and patient allocation to these clusters over time were tracked.
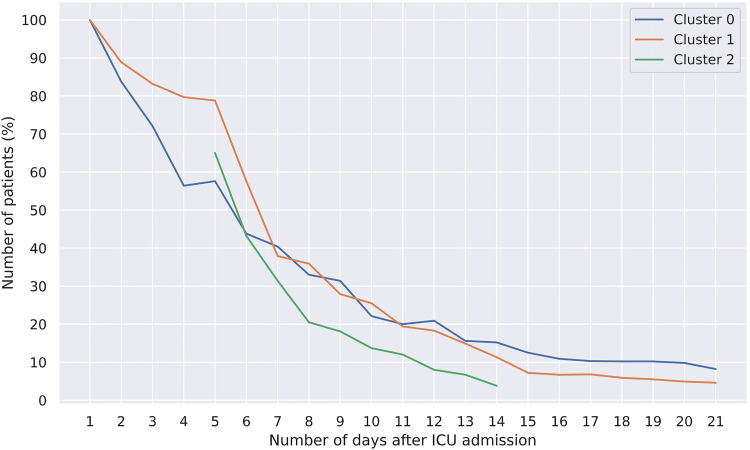
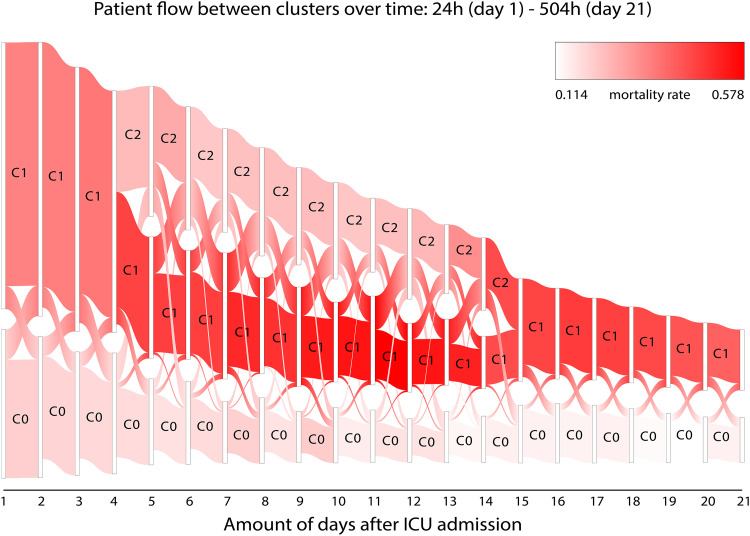
The final patient cohort consisted of 2438 COVID-19 patients with a ICU mortality outcome. Forty-one parameters were chosen for cluster analysis. On admission, both a mild and a severe clinical phenotype were found. After day 4, the severe phenotype split into an intermediate and a severe phenotype for 11 consecutive days. Heterogeneity between phenotypes appears to be driven by inflammation and dead space ventilation. During the 21-day period, only 8.2% and 4.6% of patients in the initial mild and severe clusters remained assigned to the same phenotype respectively. The clinical phenotype half-life was between 5 and 6 days for the mild and severe phenotypes, and about 3 days for the medium severe phenotype.
Patients typically do not remain in the same cluster throughout intensive care treatment. This may have important implications for prognostic or predictive enrichment. Prominent dissimilarities between clinical phenotypes are predominantly driven by inflammation and dead space ventilation.
在危重症 COVID-19 患者中识别临床表型可以提高对疾病异质性的认识,并实现预后和预测的富集。然而,以前的尝试并没有考虑到高粒度的时间动态。通过纳入时间维度,我们旨在更深入地了解 COVID-19 的异质性。
我们使用了来自荷兰数据仓库的 3202 名成年 COVID 患者的粒度数据,这些患者在 2020 年 2 月至 2021 年 3 月期间被收入 25 家荷兰 ICU 中的一家。选择了包括人口统计学、临床观察、药物、实验室值、生命体征和生命支持设备数据在内的参数。创建了 21 个数据集,每个数据集涵盖了 ICU 治疗期间每天 24 小时的 ICU 数据。通过执行聚类分析确定每个数据集的临床表型。跟踪了临床表型随时间的演变以及患者随时间的分配到这些表型的情况。
最终的患者队列包括 2438 名具有 ICU 死亡率结局的 COVID-19 患者。选择了 41 个参数进行聚类分析。入院时,发现了轻度和重度两种临床表型。第四天之后,严重表型连续 11 天分为中度和重度表型。表型之间的异质性似乎是由炎症和死腔通气驱动的。在 21 天的时间内,初始轻度和重度表型中只有 8.2%和 4.6%的患者仍然被分配到相同的表型。轻度和重度表型的临床表型半衰期分别为 5 天和 6 天,中度重度表型的半衰期约为 3 天。
患者在整个重症监护治疗过程中通常不会保持在同一聚类中。这可能对预后或预测富集有重要影响。临床表型之间的明显差异主要是由炎症和死腔通气驱动的。