Department of Radiation Medicine and Applied Sciences, University of California, San Diego, La Jolla, CA, United States of America.
Phys Med Biol. 2023 Apr 5;68(8). doi: 10.1088/1361-6560/acc37c.
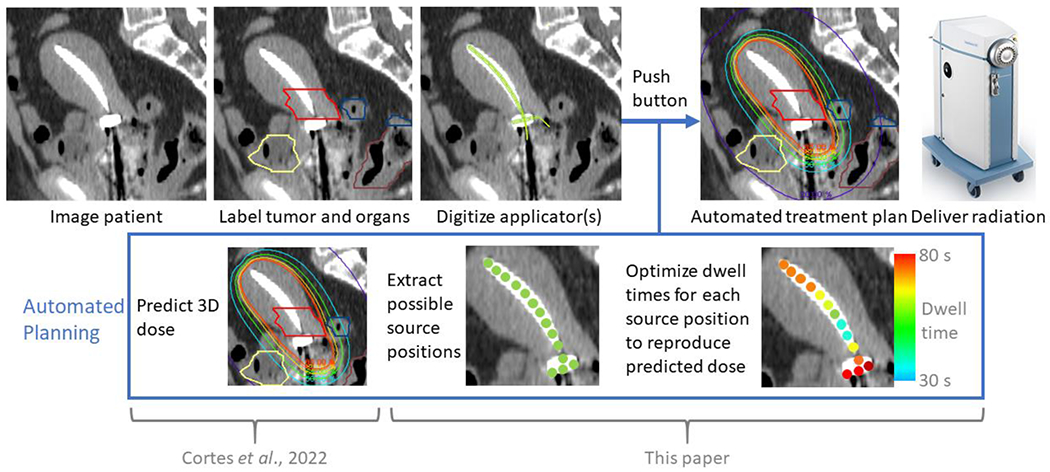
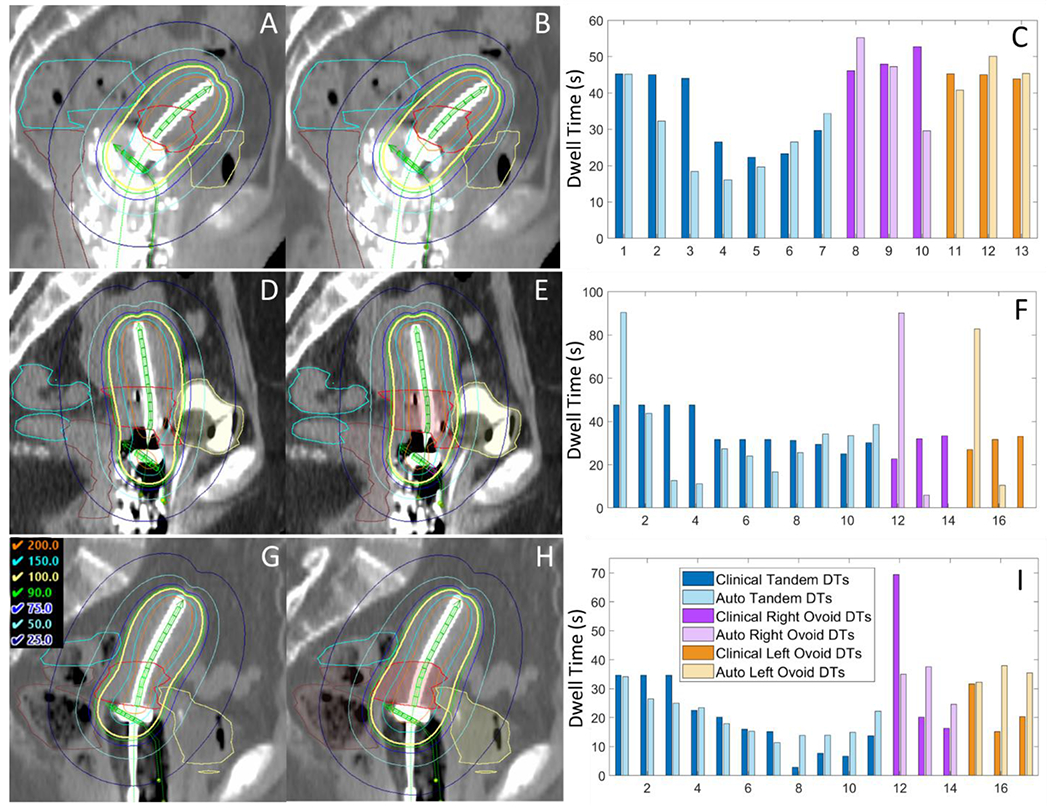
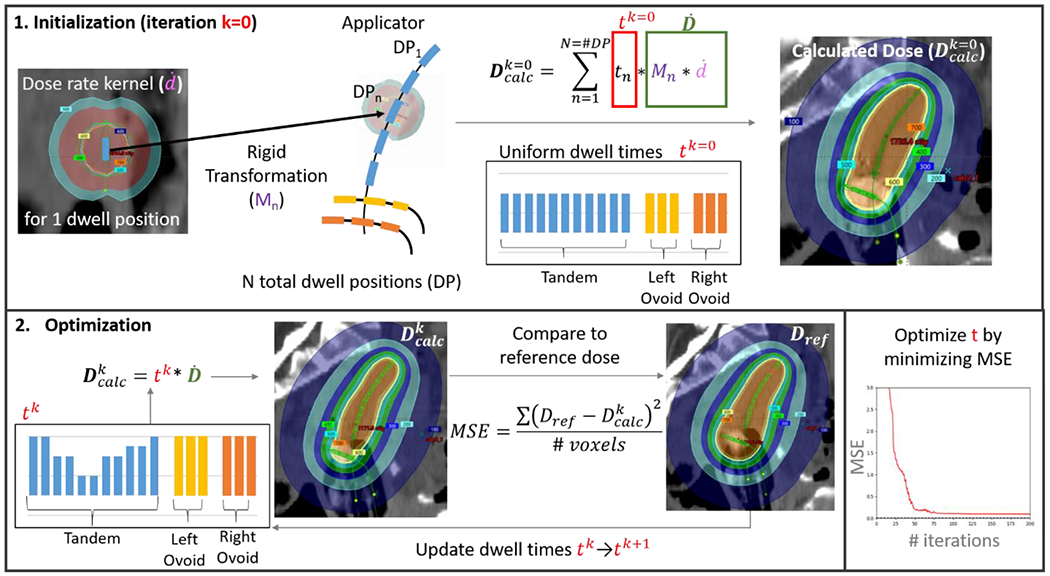
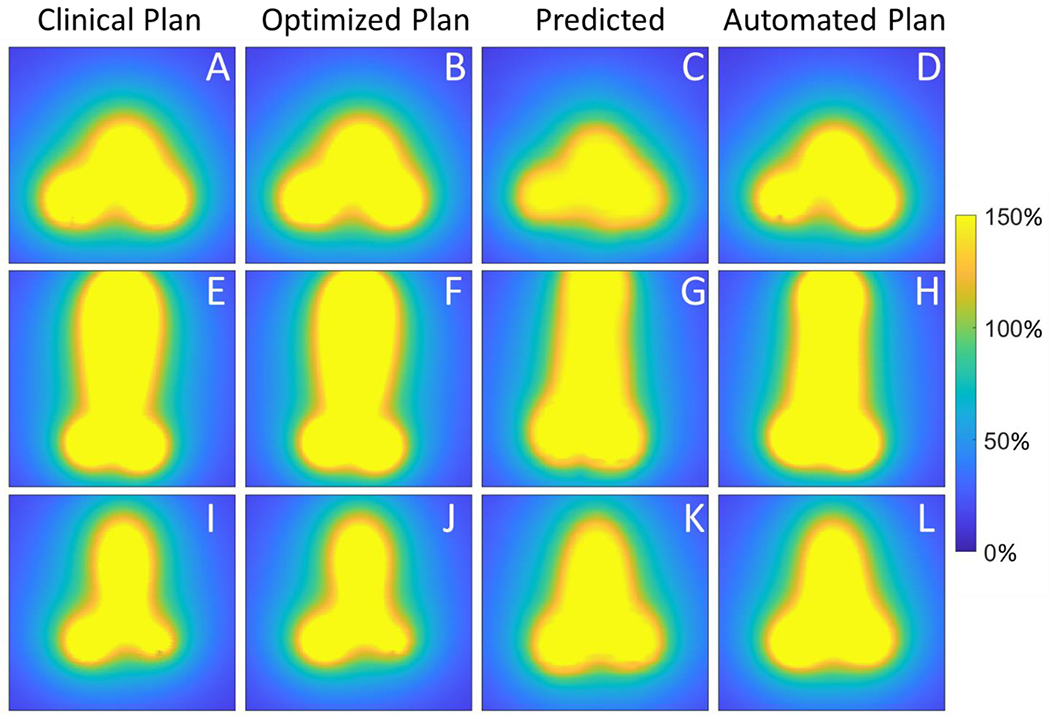
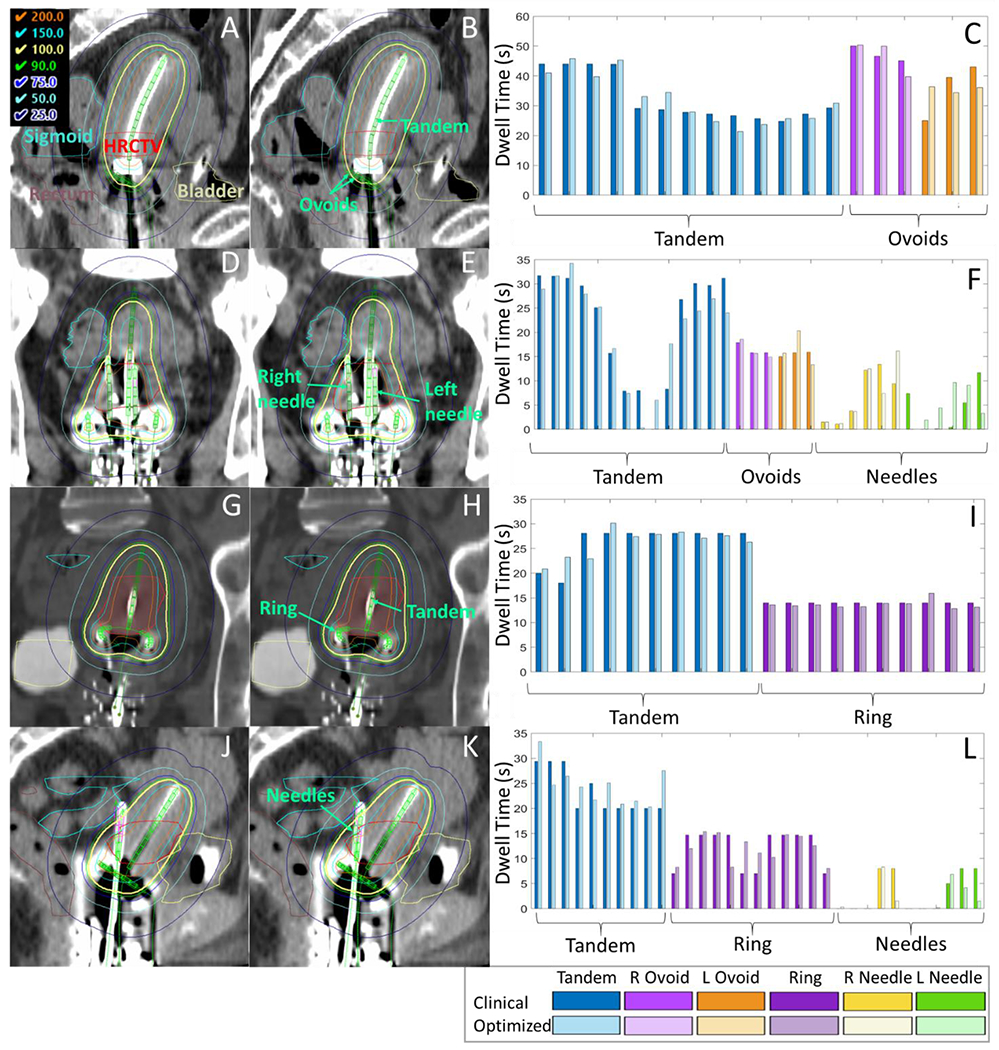
. To lay the foundation for automated knowledge-based brachytherapy treatment planning using 3D dose estimations, we describe an optimization framework to convert brachytherapy dose distributions directly into dwell times (DTs).. A dose rate kernelḋ(r,θ,φ)was produced by exporting 3D dose for one dwell position from the treatment planning system and normalizing by DT. By translating and rotating this kernel to each dwell position, scaling by DT and summing over all dwell positions, dose was computed (). We used a Python-coded COBYLA optimizer to iteratively determine the DTs that minimize the mean squared error betweenand reference dose, computed using voxels with80%-120% of prescription. As validation of the optimization, we showed that the optimizer replicates clinical plans when= clinical dose in 40 patients treated with tandem-and-ovoid (T&O) or tandem-and-ring (T&R) and 0-3 needles. Then we demonstrated automated planning in 10 T&O using= dose predicted from a convolutional neural network developed in past work. Validation and automated plans were compared to clinical plans using mean absolute differences (MAD=1N∑n=1Nabsxn-xn') over all voxels (= Dose,= #voxels) and DTs (= DT,= #dwell positions), mean differences (MD) in organand high-risk CTV D90 over all patients (where positive indicates higher clinical dose), and mean Dice similarity coefficients (DSC) for 100% isodose contours.. Validation plans agreed well with clinical plans (MAD= 1.1%, MAD= 4 s or 0.8% of total plan time,MD = -0.2% to 0.2% and D90 MD = -0.6%, DSC = 0.99). For automated plans, MAD= 6.5% and MAD= 10.3 s (2.1%). The slightly higher clinical metrics in automated plans (MD = -3.8% to 1.3% and D90 MD = -5.1%) were due to higher neural network dose predictions. The overall shape of the automated dose distributions were similar to clinical doses (DSC = 0.91).. Automated planning with 3D dose predictions could provide significant time savings and standardize treatment planning across practitioners, regardless of experience.
. 为了使用 3D 剂量估计为基于知识的自动近距离治疗计划奠定基础,我们描述了一个优化框架,可将近距离治疗剂量分布直接转换为驻留时间 (DT)。. 从治疗计划系统导出一个驻留位置的 3D 剂量,并通过 DT 归一化,生成剂量率核ḋ(r,θ,φ)。通过将该核平移和旋转到每个驻留位置,乘以 DT 并对所有驻留位置求和,计算出剂量 ()。我们使用 Python 编码的 COBYLA 优化器来迭代确定 DT,以最小化与参考剂量之间的均方误差,参考剂量是使用处方剂量的 80%-120%的体素计算得出的。作为优化的验证,我们表明,当= 40 名接受串联-椭圆形 (T&O) 或串联-环形 (T&R) 和 0-3 个针的患者的临床剂量时,优化器可以复制临床计划。然后,我们使用过去工作中开发的卷积神经网络预测的剂量,在 10 个 T&O 中演示了自动计划。使用所有体素(= 剂量,= #体素)和驻留位置(= DT,= #驻留位置)上的平均绝对差异 (MAD=1N∑n=1Nabsxn-xn')、所有患者的器官和高危 CTV D90 的平均差异 (MD)(阳性表示更高的临床剂量)以及 100%等剂量轮廓的平均 Dice 相似系数 (DSC),比较验证计划和临床计划。. 验证计划与临床计划吻合良好(MAD= 1.1%,MAD= 4 s 或总计划时间的 0.8%,MD= -0.2% 至 0.2%,D90 MD= -0.6%,DSC= 0.99)。对于自动计划,MAD= 6.5%,MAD= 10.3 s(2.1%)。自动计划中稍高的临床指标(MD= -3.8% 至 1.3%,D90 MD= -5.1%)是由于神经网络剂量预测较高。自动剂量分布的整体形状与临床剂量相似(DSC= 0.91)。. 使用 3D 剂量预测的自动计划可以显著节省时间,并使不同经验的医生之间的治疗计划标准化。