Dudle Alice, Gugler Yvan, Pretterklieber Michael, Ferrari Serge, Lippuner Kurt, Zysset Philippe
ARTORG Center for Biomedical Engineering Research, University of Bern, Bern, Switzerland.
Division of Anatomy, Gottfried Schatz Research Center, Medical University of Graz, Graz, Austria.
Front Bioeng Biotechnol. 2023 Mar 1;11:1111020. doi: 10.3389/fbioe.2023.1111020. eCollection 2023.
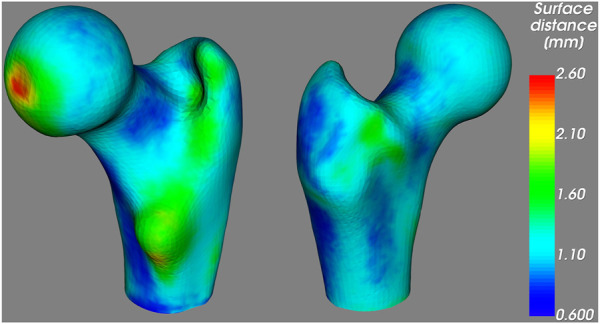
Osteoporosis is currently diagnosed based on areal bone mineral density (aBMD) computed from 2D DXA scans. However, aBMD is a limited surrogate for femoral strength since it does not account for 3D bone geometry and density distribution. QCT scans combined with finite element (FE) analysis can deliver improved femoral strength predictions. However, non-negligible radiation dose and high costs prevent a systematic usage of this technique for screening purposes. As an alternative, the 3D-Shaper software (3D-Shaper Medical, Spain) reconstructs the 3D shape and density distribution of the femur from 2D DXA scans. This approach could deliver a more accurate estimation of femoral strength than aBMD by using FE analysis on the reconstructed 3D DXA. Here we present the first independent evaluation of the software, using a dataset of 77 femora. We extend a prior evaluation by including the density distribution differences, the spatial correlation of density values and an FE analysis. Yet, cortical thickness is left out of this evaluation, since the cortex is not resolved in our FE models. We found an average surface distance of 1.16 mm between 3D DXA and QCT images, which shows a good reconstruction of the bone geometry. Although BMD values obtained from 3D DXA and QCT correlated well ( = 0.92), the 3D DXA BMD were systematically lower. The average BMD difference amounted to 64 mg/cm, more than one-third of the 3D DXA BMD. Furthermore, the low correlation ( = 0.48) between density values of both images indicates a limited reconstruction of the 3D density distribution. FE results were in good agreement between QCT and 3D DXA images, with a high coefficient of determination ( = 0.88). However, this correlation was not statistically different from a direct prediction by aBMD. Moreover, we found differences in the fracture patterns between the two image types. QCT-based FE analysis resulted mostly in femoral neck fractures and 3D DXA-based FE in subcapital or pertrochanteric fractures. In conclusion, 3D-Shaper generates an altered BMD distribution compared to QCT but, after careful density calibration, shows an interesting potential for deriving a standardized femoral strength from a DXA scan.
目前,骨质疏松症是根据二维双能X线吸收法(DXA)扫描计算得出的面积骨密度(aBMD)来诊断的。然而,aBMD作为股骨强度的替代指标存在局限性,因为它没有考虑三维骨几何结构和密度分布。定量计算机断层扫描(QCT)结合有限元(FE)分析可以提供更准确的股骨强度预测。然而,不可忽视的辐射剂量和高昂的成本阻碍了该技术在筛查中的系统应用。作为一种替代方法,3D-Shaper软件(3D-Shaper Medical,西班牙)可根据二维DXA扫描重建股骨的三维形状和密度分布。通过对重建的三维DXA进行有限元分析,这种方法可以比aBMD更准确地估计股骨强度。在此,我们使用包含77根股骨的数据集对该软件进行了首次独立评估。我们通过纳入密度分布差异、密度值的空间相关性和有限元分析,扩展了先前的评估。然而,由于皮质在我们的有限元模型中未得到解析,因此在此次评估中未考虑皮质厚度。我们发现三维DXA图像与QCT图像之间的平均表面距离为1.16毫米,这表明骨几何结构的重建效果良好。尽管从三维DXA和QCT获得的骨密度值相关性良好(r = 0.92),但三维DXA骨密度值系统性地较低。平均骨密度差异达64毫克/平方厘米,超过三维DXA骨密度的三分之一。此外,两种图像密度值之间的低相关性(r = 0.48)表明三维密度分布的重建效果有限。有限元分析结果在QCT图像和三维DXA图像之间具有良好的一致性,决定系数较高(r = 0.88)。然而,这种相关性与aBMD直接预测结果在统计学上并无差异。此外,我们发现两种图像类型的骨折模式存在差异。基于QCT的有限元分析主要导致股骨颈骨折,而基于三维DXA的有限元分析则导致股骨头下或转子周围骨折。总之,与QCT相比,3D-Shaper生成了不同的骨密度分布,但经过仔细的密度校准后,显示出从DXA扫描得出标准化股骨强度的有趣潜力。