• 文献检索
  • 文档翻译
  • 深度研究
  • 学术资讯
  • Suppr Zotero 插件Zotero 插件
  • 邀请有礼
  • 套餐&价格
  • 历史记录
应用&插件
Suppr Zotero 插件Zotero 插件浏览器插件Mac 客户端Windows 客户端微信小程序
定价
高级版会员购买积分包购买API积分包
服务
文献检索文档翻译深度研究API 文档MCP 服务
关于我们
关于 Suppr公司介绍联系我们用户协议隐私条款
关注我们

Suppr 超能文献

核心技术专利:CN118964589B侵权必究
粤ICP备2023148730 号-1Suppr @ 2026

文献检索

告别复杂PubMed语法,用中文像聊天一样搜索,搜遍4000万医学文献。AI智能推荐,让科研检索更轻松。

立即免费搜索

文件翻译

保留排版,准确专业,支持PDF/Word/PPT等文件格式,支持 12+语言互译。

免费翻译文档

深度研究

AI帮你快速写综述,25分钟生成高质量综述,智能提取关键信息,辅助科研写作。

立即免费体验

新冠疫情期间的股票市场优化:技术分析、K均值算法与均值-方差模型(TAKMV)方法

Stock market optimization amidst the COVID-19 pandemic: Technical analysis, K-means algorithm, and mean-variance model (TAKMV) approach.

作者信息

Navarro Maricar M, Young Michael Nayat, Prasetyo Yogi Tri, Taylar Jonathan V

机构信息

School of Industrial Engineering and Engineering Management, Mapúa University, 658 Muralla St., Intramuros, Manila 1002, Philippines.

School of Graduate Studies, Mapúa University, 658 Muralla St., Intramuros, Manila 1002, Philippines.

出版信息

Heliyon. 2023 Jul;9(7):e17577. doi: 10.1016/j.heliyon.2023.e17577. Epub 2023 Jun 22.

DOI:10.1016/j.heliyon.2023.e17577
PMID:37366512
原文链接:https://pmc.ncbi.nlm.nih.gov/articles/PMC10287180/
Abstract

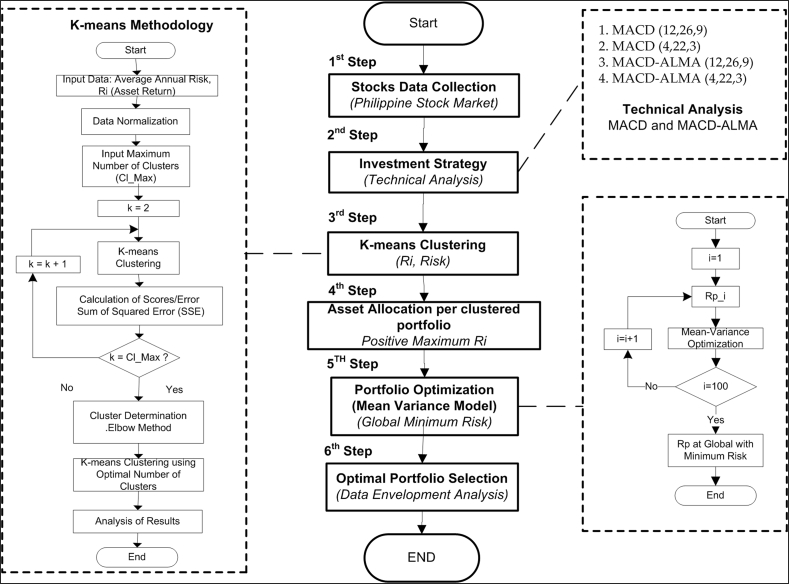
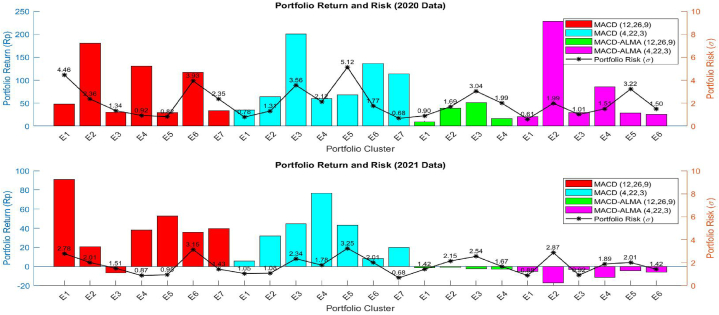
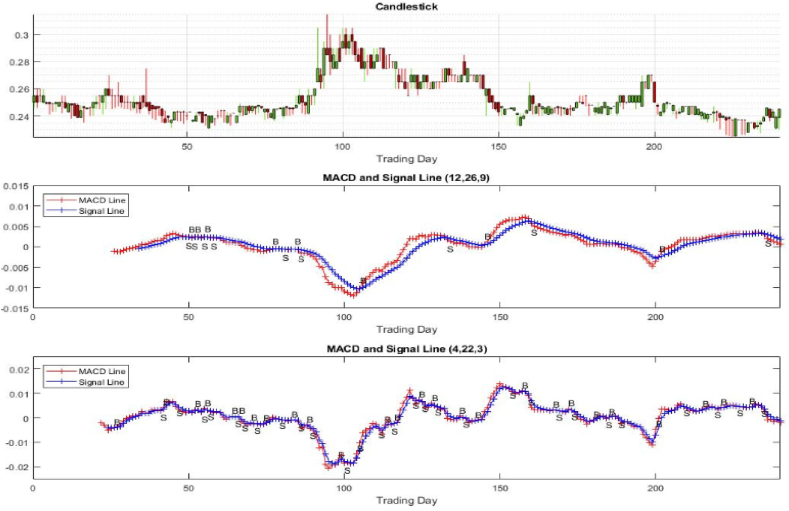
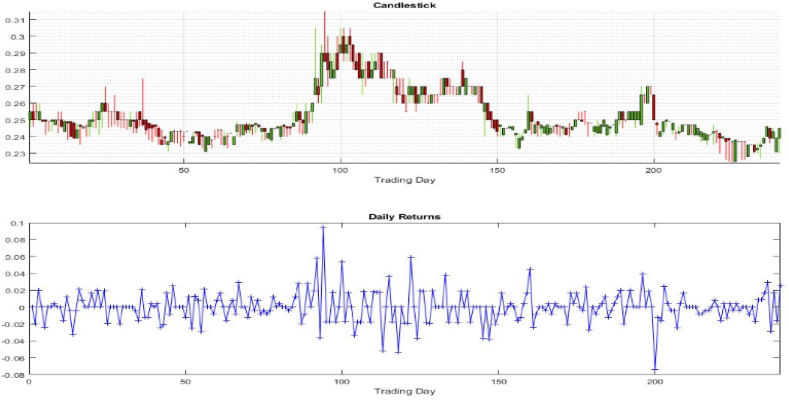
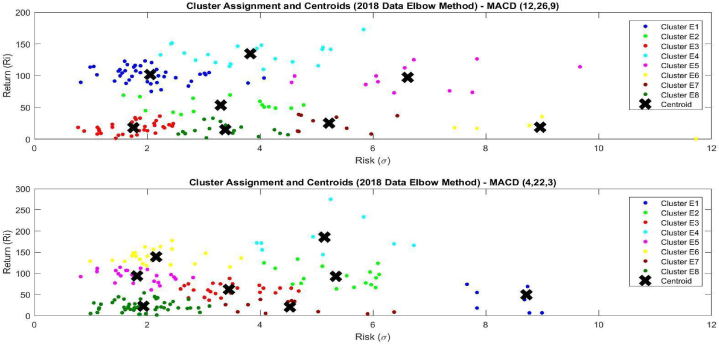
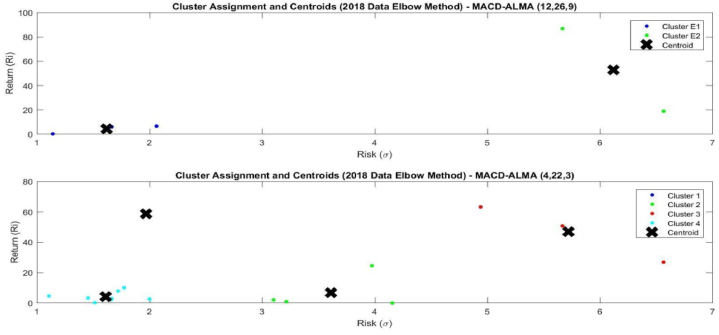
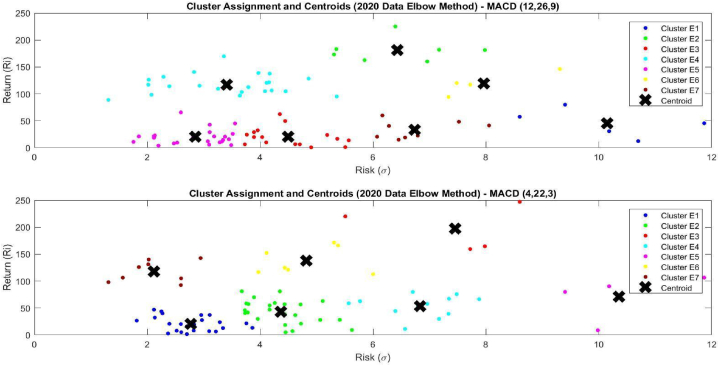
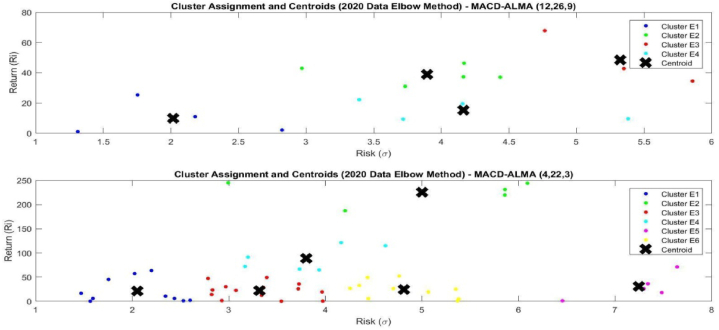
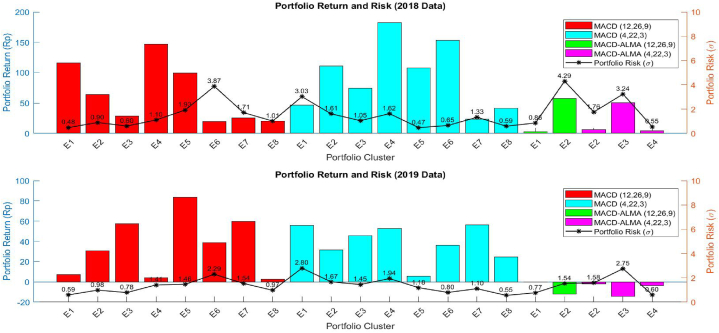
The Philippine stock market, just like most of its neighbors in the region, was seriously impacted by the global pandemic COVID-19. Investors remain hopeful while continuing to seek great ones in the damaged market. This paper developed a methodology for portfolio selection and optimization with the use of technical analysis, machine learning techniques, and portfolio optimization model. The combined methods of technical analysis, K-means clustering algorithm, and mean-variance portfolio optimization model will result in the development of the proposed TAKMV method. The study aims to integrate these three important analyses to identify portfolio investments. This paper uses the average annual risk and annual rate of return data for the years 2018 and 2020 to form the clusters and assessed the stocks that correspond to the investor's technical strategy such as Moving Average Convergence/Divergence (MACD) and Hybrid MACD with Arnaud Legoux Moving Average (ALMA). This paper solved the risk minimization problem on selected shares of the companies, based on the mean-variance portfolio optimization model. There are 230 and 239 companies for 2018 and 2020, respectively, listed in Philippine Stock Market, and all simulations were performed in MATLAB environment platform. Results showed that MACD strategy dominates the MACD-ALMA strategy in terms of the number of assets with a positive annual rate of return. The MACD works efficiently in the pre-COVID-19 condition while MACD-ALMA works efficiently during-COVID-19 condition, regardless of the number of assets with a positive annual rate of return. The results also show that the maximum expected portfolio return () can be achieved using the MACD and MACD-ALMA in the pre-and during-COVID-19 conditions, respectively. The MACD-ALMA shows an advantage during high-risk market conditions and can also provide maximum . The performance of the TAKMV method was validated by applying its results and comparing it to the next year's historical price. The 2018 results were compared to 2019 data and the 2020 results were compared to 2021 data. For consistency, the comparison was applied to the same company per portfolio. Simulation results show that the MACD strategy is more effective compared to MACD-ALMA.

摘要

与该地区的大多数邻国一样,菲律宾股市受到全球新冠疫情的严重冲击。投资者在受损的市场中仍满怀希望,同时继续寻找优质投资标的。本文运用技术分析、机器学习技术和投资组合优化模型,开发了一种投资组合选择与优化方法。将技术分析、K均值聚类算法和均值-方差投资组合优化模型相结合的方法,将产生本文所提出的TAKMV方法。该研究旨在整合这三种重要分析方法以识别投资组合。本文使用2018年和2020年的年均风险和年回报率数据来形成聚类,并评估与投资者技术策略相对应的股票,如移动平均收敛/发散指标(MACD)以及结合了阿诺德·勒古克斯移动平均线(ALMA)的混合MACD指标。本文基于均值-方差投资组合优化模型,解决了所选公司股票的风险最小化问题。菲律宾证券市场在2018年和2020年分别有230家和239家公司上市,所有模拟均在MATLAB环境平台上进行。结果表明,就年回报率为正的资产数量而言,MACD策略优于MACD-ALMA策略。无论年回报率为正的资产数量如何,MACD在新冠疫情前的情况下有效运作而MACD-ALMA在新冠疫情期间有效运作;结果还表明,在新冠疫情前和疫情期间分别使用MACD和MACD-ALMA可以实现最大预期投资组合回报()。MACD-ALMA在高风险市场条件下显示出优势,并且也能提供最大回报。通过应用TAKMV方法的结果并将其与下一年的历史价格进行比较,验证了该方法的性能。将2018年的结果与2019年的数据进行比较,将2020年的结果与2021年的数据进行比较。为保持一致性,每个投资组合的比较都应用于同一家公司。模拟结果表明,MACD策略比MACD-ALMA更有效。

https://cdn.ncbi.nlm.nih.gov/pmc/blobs/c85c/10338318/76b14243eb83/gr12.jpg
https://cdn.ncbi.nlm.nih.gov/pmc/blobs/c85c/10338318/a0c3650ac79c/gr1.jpg
https://cdn.ncbi.nlm.nih.gov/pmc/blobs/c85c/10338318/eb34356e98f1/gr2.jpg
https://cdn.ncbi.nlm.nih.gov/pmc/blobs/c85c/10338318/08b47bc19bcb/gr3.jpg
https://cdn.ncbi.nlm.nih.gov/pmc/blobs/c85c/10338318/888edcc4232b/gr4.jpg
https://cdn.ncbi.nlm.nih.gov/pmc/blobs/c85c/10338318/645b6099e21e/gr5.jpg
https://cdn.ncbi.nlm.nih.gov/pmc/blobs/c85c/10338318/94b33c2205ed/gr6.jpg
https://cdn.ncbi.nlm.nih.gov/pmc/blobs/c85c/10338318/581bac77fa7c/gr7.jpg
https://cdn.ncbi.nlm.nih.gov/pmc/blobs/c85c/10338318/b76f8554e289/gr8.jpg
https://cdn.ncbi.nlm.nih.gov/pmc/blobs/c85c/10338318/111adcf14cdd/gr9.jpg
https://cdn.ncbi.nlm.nih.gov/pmc/blobs/c85c/10338318/9f86386d7e75/gr10.jpg
https://cdn.ncbi.nlm.nih.gov/pmc/blobs/c85c/10338318/ea4b634b83c6/gr11.jpg
https://cdn.ncbi.nlm.nih.gov/pmc/blobs/c85c/10338318/76b14243eb83/gr12.jpg

相似文献

1
Stock market optimization amidst the COVID-19 pandemic: Technical analysis, K-means algorithm, and mean-variance model (TAKMV) approach.新冠疫情期间的股票市场优化:技术分析、K均值算法与均值-方差模型(TAKMV)方法
Heliyon. 2023 Jul;9(7):e17577. doi: 10.1016/j.heliyon.2023.e17577. Epub 2023 Jun 22.
2
Stock Portfolio Optimization Using a Combined Approach of Multi Objective Grey Wolf Optimizer and Machine Learning Preselection Methods.基于多目标灰狼优化算法和机器学习预选方法的股票投资组合优化。
Comput Intell Neurosci. 2022 Aug 29;2022:5974842. doi: 10.1155/2022/5974842. eCollection 2022.
3
Corrigendum to "Stock market optimization amidst the COVID-19 pandemic: Technical analysis, K-means algorithm, and mean-variance model (TAKMV) approach" [9(7) (July 2023) e17577].《“新冠疫情期间的股票市场优化:技术分析、K均值算法和均值-方差模型(TAKMV)方法”勘误》[9(7)(2023年7月)e17577]
Heliyon. 2023 Aug 3;9(8):e18640. doi: 10.1016/j.heliyon.2023.e18640. eCollection 2023 Aug.
4
Is It Possible to Earn Abnormal Return in an Inefficient Market? An Approach Based on Machine Learning in Stock Trading.在非有效市场中是否有可能获得异常收益?基于机器学习的股票交易方法。
Comput Intell Neurosci. 2021 Dec 8;2021:2917577. doi: 10.1155/2021/2917577. eCollection 2021.
5
An integrated fuzzy-grey relational analysis approach to portfolio optimization.一种用于投资组合优化的集成模糊灰色关联分析方法。
Appl Intell (Dordr). 2023;53(4):3804-3835. doi: 10.1007/s10489-022-03499-z. Epub 2022 Jun 2.
6
Applying attention-based BiLSTM and technical indicators in the design and performance analysis of stock trading strategies.基于注意力的双向长短期记忆网络与技术指标在股票交易策略设计与性能分析中的应用。
Neural Comput Appl. 2022;34(16):13267-13279. doi: 10.1007/s00521-021-06828-4. Epub 2022 Jan 28.
7
Stock portfolio structure of individual investors infers future trading behavior.个人投资者的股票投资组合结构推断未来交易行为。
PLoS One. 2014 Jul 28;9(7):e103006. doi: 10.1371/journal.pone.0103006. eCollection 2014.
8
Predicting Stock Price Falls Using News Data: Evidence from the Brazilian Market.利用新闻数据预测股价下跌:来自巴西市场的证据。
Comput Econ. 2021;57(1):311-340. doi: 10.1007/s10614-020-10060-y. Epub 2020 Nov 17.
9
An Intelligent Fusion Model with Portfolio Selection and Machine Learning for Stock Market Prediction.基于投资组合选择和机器学习的股票市场预测智能融合模型。
Comput Intell Neurosci. 2022 Jun 23;2022:7588303. doi: 10.1155/2022/7588303. eCollection 2022.
10
Stochastic portfolio optimization: A regret-based approach on volatility risk measures: An empirical evidence from The New York stock market.随机投资组合优化:基于后悔的波动率风险度量方法:来自纽约股票市场的实证证据。
PLoS One. 2024 Apr 22;19(4):e0299699. doi: 10.1371/journal.pone.0299699. eCollection 2024.

本文引用的文献

1
K-means for shared frailty models.K-均值共享脆弱性模型。
BMC Med Res Methodol. 2022 Jan 12;22(1):11. doi: 10.1186/s12874-021-01424-5.
2
Impact of COVID-19 on stock market efficiency: Evidence from developed countries.新冠疫情对股票市场效率的影响:来自发达国家的证据。
Res Int Bus Finance. 2021 Dec;58:101445. doi: 10.1016/j.ribaf.2021.101445. Epub 2021 May 29.
3
The Impact of COVID-19 Pandemic on Stock Market: Evidence from Romania.新冠疫情对罗马尼亚股票市场的影响。
Int J Environ Res Public Health. 2021 Sep 3;18(17):9315. doi: 10.3390/ijerph18179315.
4
Stock Market Reactions to COVID-19 Pandemic Outbreak: Quantitative Evidence from ARDL Bounds Tests and Granger Causality Analysis.新冠疫情爆发对股市的反应:来自 ARDL 边界检验和格兰杰因果分析的定量证据。
Int J Environ Res Public Health. 2020 Sep 15;17(18):6729. doi: 10.3390/ijerph17186729.
5
Death and contagious infectious diseases: Impact of the COVID-19 virus on stock market returns.死亡与传染性疾病:新冠病毒对股市回报的影响。
J Behav Exp Finance. 2020 Sep;27:100326. doi: 10.1016/j.jbef.2020.100326. Epub 2020 Apr 8.