• 文献检索
  • 文档翻译
  • 深度研究
  • 学术资讯
  • Suppr Zotero 插件Zotero 插件
  • 邀请有礼
  • 套餐&价格
  • 历史记录
应用&插件
Suppr Zotero 插件Zotero 插件浏览器插件Mac 客户端Windows 客户端微信小程序
定价
高级版会员购买积分包购买API积分包
服务
文献检索文档翻译深度研究API 文档MCP 服务
关于我们
关于 Suppr公司介绍联系我们用户协议隐私条款
关注我们

Suppr 超能文献

核心技术专利:CN118964589B侵权必究
粤ICP备2023148730 号-1Suppr @ 2026

文献检索

告别复杂PubMed语法,用中文像聊天一样搜索,搜遍4000万医学文献。AI智能推荐,让科研检索更轻松。

立即免费搜索

文件翻译

保留排版,准确专业,支持PDF/Word/PPT等文件格式,支持 12+语言互译。

免费翻译文档

深度研究

AI帮你快速写综述,25分钟生成高质量综述,智能提取关键信息,辅助科研写作。

立即免费体验

使用时间条形图可视化在 MDPI 期刊上发表研究的四位作者的突发点,这些期刊被命名为 2021 年引文桂冠奖。

Visualizing burst spots on research for four authors in MDPI journals named to be Citation Laureates 2021 using temporal bar graph.

机构信息

Department of Emergency Medicine, Chi-Mei Medical Center, Tainan, Taiwan.

Department of Medical Research, Chi-Mei Medical Center, Tainan, Taiwan.

出版信息

Medicine (Baltimore). 2023 Aug 11;102(32):e34578. doi: 10.1097/MD.0000000000034578.

DOI:10.1097/MD.0000000000034578
PMID:37565889
原文链接:https://pmc.ncbi.nlm.nih.gov/articles/PMC10419625/
Abstract

BACKGROUND

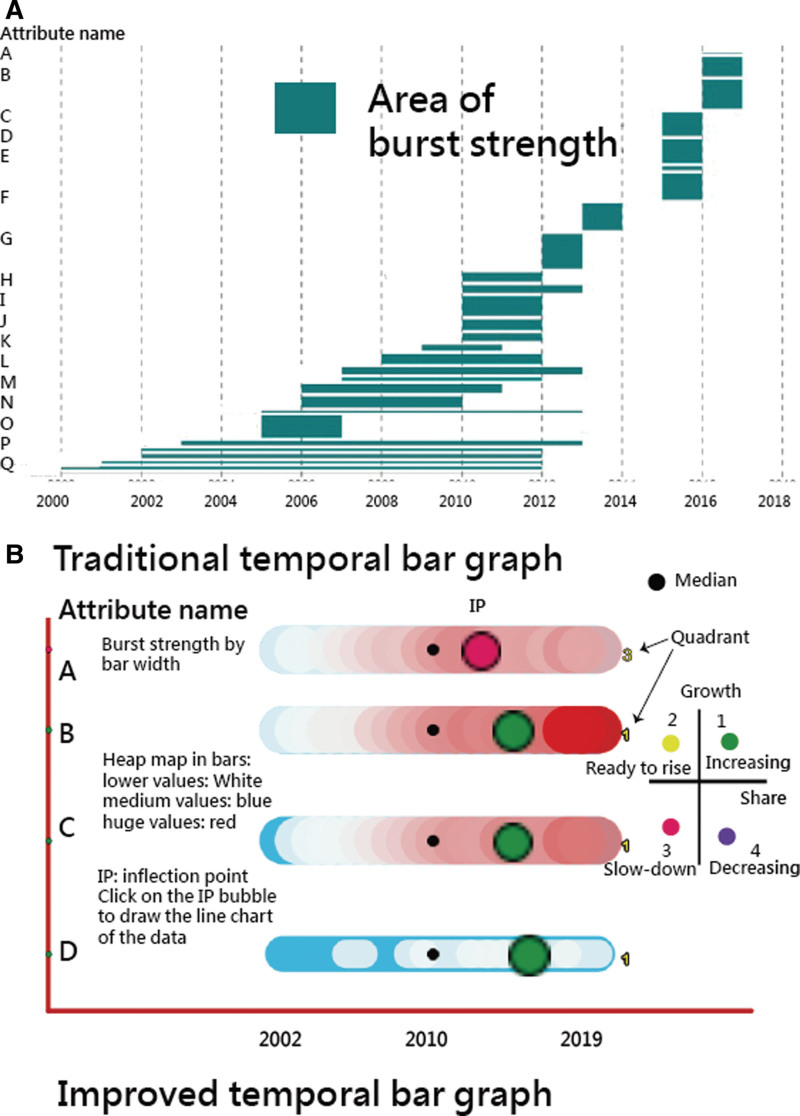
The appearance of a topic in a document stream is signaled by a burst of activity, with certain features rising sharply in frequency as the topic emerges. Although temporal bar graph (TBG) is frequently applied to present the burst spot in the bibliographical study, none of the research has combined the inflection point (IP) to interpret the burst spot feature. The aims of this study are to improve the traditional TBG and apply the TBG to understand better the evolution of a topic (e.g., publications and citations for a given author).

METHODS

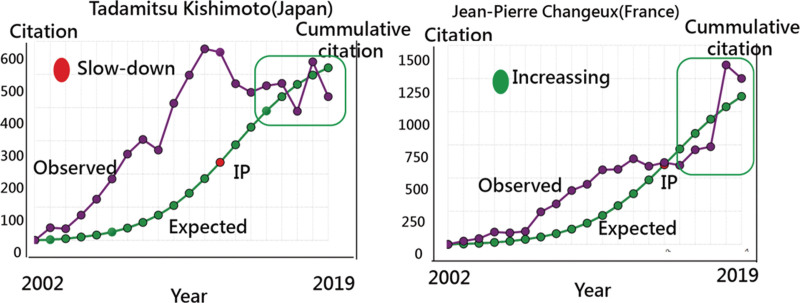
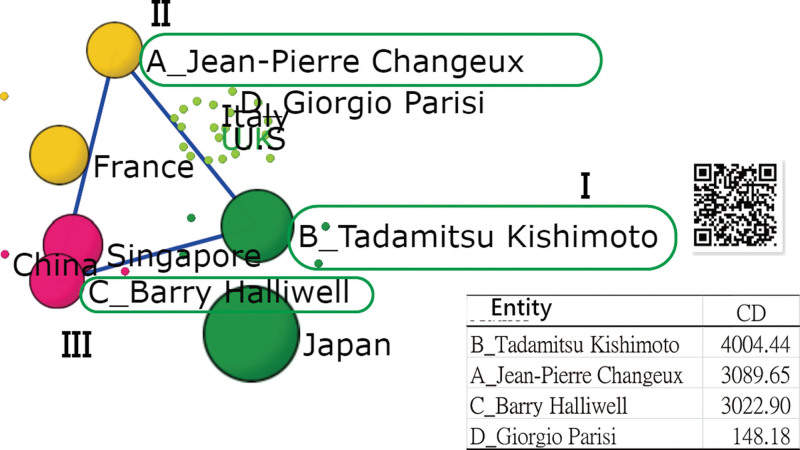
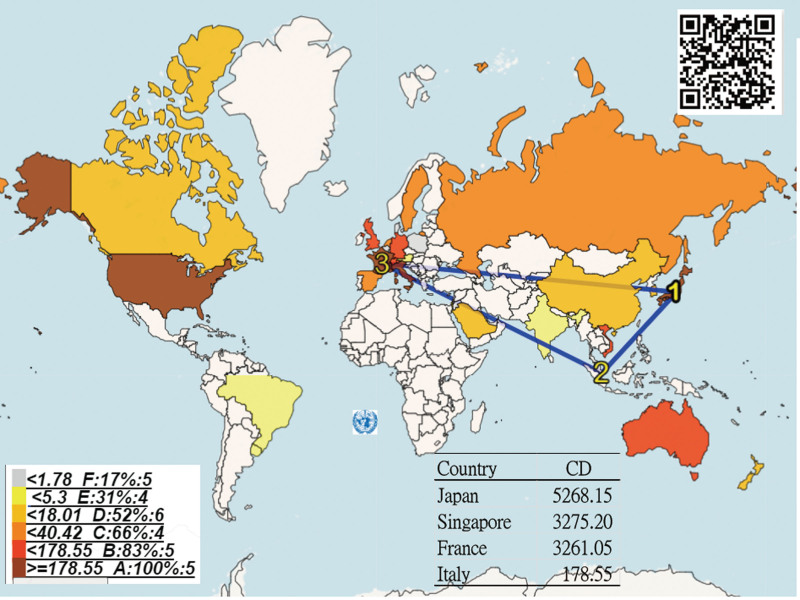
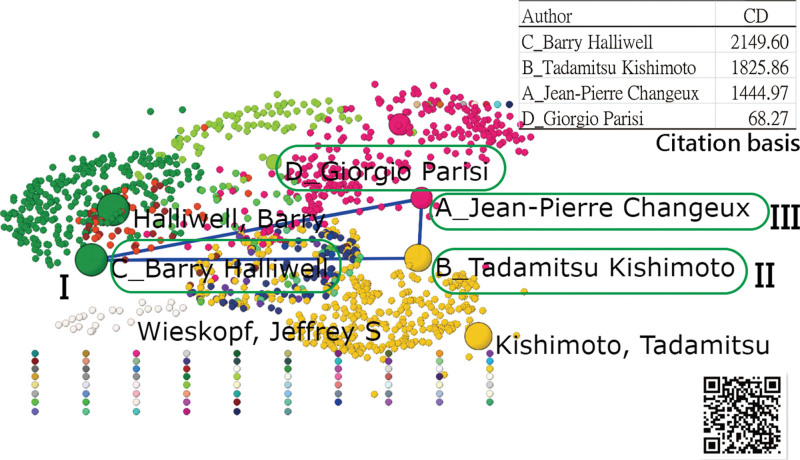
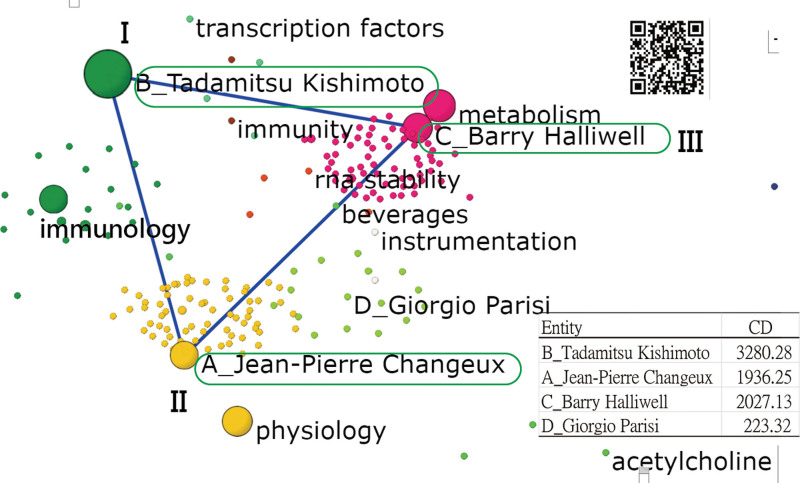
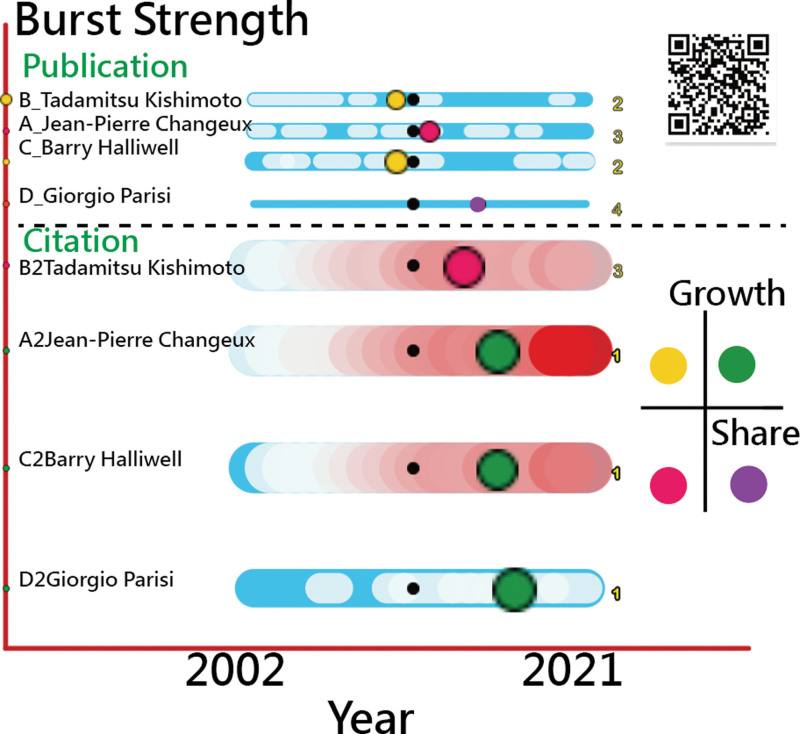
The EISTL model, including entity, indicator, selection of a few vital ones (named attributes) with higher values in quantity (e.g., the citation data of the top 10 entities), TBG and line-chart plots to verify the trend of interest, was proposed to demonstrate the TBG as a whole. The IP locations compared to the median point in data along with the heap map and line-chart trend were identified. The burst strength was computed. A dashboard on Google Maps was designed and launched for bibliometric analysis. Four authors in MDPI (Multidisciplinary Digital Publishing Institute) journals named to be Citation Laureates 2021 were recruited to compare their research achievements shown on the TBG, particularly displaying the burst spots and the recent developments and stages (e.g., increasing, ready to increase, slowdown, or decreasing).

RESULTS

We observed that the highest burst strengths in publication and citations are earned by Barry Halliwell (8.99) and Jean-Pierre Changeux (18.01). The breakthrough of TBG using the EISTL model to display the influence of authors in academics was made with 2 parts of the primary IP point and the trend feature in the data.

CONCLUSION

The dashboard-type TBG shown on Google Maps is unique and innovative and able to provide deeper insights to readers, not merely limited to the publications and citations for a given author as we did in this study.

摘要

背景

主题在文献流中的出现是由一段活动爆发所标志的,随着主题的出现,某些特征的频率会急剧上升。尽管时间条形图(TBG)常用于呈现文献研究中的爆发点,但没有一项研究将拐点(IP)结合起来解释爆发点特征。本研究旨在改进传统的 TBG,并应用 TBG 来更好地理解主题的演变(例如,给定作者的出版物和引文)。

方法

EISTL 模型包括实体、指标、选择数量较高的少数重要指标(命名为属性)(例如,排名前 10 位实体的引文数据)、TBG 和折线图来验证感兴趣的趋势,提出了整个 TBG。比较数据中位数的 IP 位置以及堆图和折线图趋势来确定 IP 位置。计算了爆发强度。设计并推出了一个基于 Google 地图的仪表板进行文献计量分析。招募了 MDPI(多学科数字出版机构)期刊的四位被提名为 2021 年引文桂冠奖的作者,比较他们在 TBG 上展示的研究成果,特别是显示爆发点以及最新发展和阶段(例如,增加、准备增加、放缓或减少)。

结果

我们观察到,在出版物和引文方面,最高的爆发强度是由 Barry Halliwell(8.99)和 Jean-Pierre Changeux(18.01)获得的。使用 EISTL 模型显示作者在学术界影响力的 TBG 突破了两个主要 IP 点和数据中的趋势特征。

结论

在 Google 地图上显示的仪表板类型 TBG 是独特且创新的,能够为读者提供更深入的见解,而不仅仅局限于本研究中我们对给定作者的出版物和引文的分析。

https://cdn.ncbi.nlm.nih.gov/pmc/blobs/4d56/10419625/a21daf424206/medi-102-e34578-g007.jpg
https://cdn.ncbi.nlm.nih.gov/pmc/blobs/4d56/10419625/1161d7602111/medi-102-e34578-g001.jpg
https://cdn.ncbi.nlm.nih.gov/pmc/blobs/4d56/10419625/3f59a40f5f8b/medi-102-e34578-g002.jpg
https://cdn.ncbi.nlm.nih.gov/pmc/blobs/4d56/10419625/e6a2a4ccf6d4/medi-102-e34578-g003.jpg
https://cdn.ncbi.nlm.nih.gov/pmc/blobs/4d56/10419625/83499861bff7/medi-102-e34578-g004.jpg
https://cdn.ncbi.nlm.nih.gov/pmc/blobs/4d56/10419625/e6cae5d3ea5e/medi-102-e34578-g005.jpg
https://cdn.ncbi.nlm.nih.gov/pmc/blobs/4d56/10419625/e28f5f036a45/medi-102-e34578-g006.jpg
https://cdn.ncbi.nlm.nih.gov/pmc/blobs/4d56/10419625/a21daf424206/medi-102-e34578-g007.jpg

相似文献

1
Visualizing burst spots on research for four authors in MDPI journals named to be Citation Laureates 2021 using temporal bar graph.使用时间条形图可视化在 MDPI 期刊上发表研究的四位作者的突发点,这些期刊被命名为 2021 年引文桂冠奖。
Medicine (Baltimore). 2023 Aug 11;102(32):e34578. doi: 10.1097/MD.0000000000034578.
2
Trend and prediction of citations on the topic of neuromuscular junctions in 100 top-cited articles since 2001 using a temporal bar graph: A bibliometric analysis.使用时间条形图分析 2001 年以来 100 篇高引论文中神经肌肉接头主题的引文趋势和预测:文献计量分析。
Medicine (Baltimore). 2022 Oct 7;101(40):e30674. doi: 10.1097/MD.0000000000030674.
3
Using the Sankey diagram to visualize article features on the topics of whole-exome sequencing (WES) and whole-genome sequencing (WGS) since 2012: Bibliometric analysis.运用桑基图可视化 2012 年以来全外显子组测序(WES)和全基因组测序(WGS)主题的文章特征:文献计量分析。
Medicine (Baltimore). 2022 Sep 23;101(38):e30682. doi: 10.1097/MD.0000000000030682.
4
Citation trends in ophthalmology articles and keywords in mainland China, Hong Kong, and Taiwan since 2013 using temporal bar graphs (TBGs): Bibliometric analysis.2013 年以来中国大陆、香港和台湾地区眼科文献的引文趋势和关键词:时间条形图(TBG)的文献计量分析。
Medicine (Baltimore). 2022 Dec 30;101(52):e32392. doi: 10.1097/MD.0000000000032392.
5
Suggestions to the article: demonstrating the ascendancy of COVID-19 research using acronyms.对该文章的建议:展示使用首字母缩略词的COVID-19研究的优势。
Scientometrics. 2022;127(5):2897-2899. doi: 10.1007/s11192-022-04302-z. Epub 2022 Mar 12.
6
Visualizing the features of inflection point shown on a temporal bar graph using the data of COVID-19 pandemic.利用 COVID-19 大流行的数据,可视化时间条形图上的拐点特征。
Medicine (Baltimore). 2022 Feb 4;101(5):e28749. doi: 10.1097/MD.0000000000028749.
7
From Excessive Journal Self-Cites to Citation Stacking: Analysis of Journal Self-Citation Kinetics in Search for Journals, Which Boost Their Scientometric Indicators.从过度的期刊自引到引文堆砌:对期刊自引动力学的分析以寻找提升其科学计量指标的期刊
PLoS One. 2016 Apr 18;11(4):e0153730. doi: 10.1371/journal.pone.0153730. eCollection 2016.
8
Folic acid supplementation and malaria susceptibility and severity among people taking antifolate antimalarial drugs in endemic areas.在流行地区,服用抗叶酸抗疟药物的人群中,叶酸补充剂与疟疾易感性和严重程度的关系。
Cochrane Database Syst Rev. 2022 Feb 1;2(2022):CD014217. doi: 10.1002/14651858.CD014217.
9
Multiple Citation Indicators and Their Composite across Scientific Disciplines.跨学科的多种引用指标及其综合指标
PLoS Biol. 2016 Jul 1;14(7):e1002501. doi: 10.1371/journal.pbio.1002501. eCollection 2016 Jul.
10
The Most-Cited Authors Who Published Papers in JMIR mHealth and uHealth Using the Authorship-Weighted Scheme: Bibliometric Analysis.使用作者权重方案在 JMIR mHealth 和 uHealth 上发表论文的被引频次最高的作者:文献计量分析。
JMIR Mhealth Uhealth. 2020 May 7;8(5):e11567. doi: 10.2196/11567.

引用本文的文献

1
Unexpected aberrant data patterns on slope graphs to examine article characteristics: Say good-bye to the burst bar chart in bibliometrics.用于检查文章特征的斜率图上出现意外的异常数据模式:告别文献计量学中的爆发式柱状图。
Medicine (Baltimore). 2025 Aug 29;104(35):e42657. doi: 10.1097/MD.0000000000042657.
2
Analyzing shifts in age-related macular degeneration research trends since 2014: A bibliometric study with triple-map Sankey diagrams (TMSD).分析 2014 年以来年龄相关性黄斑变性研究趋势的转变:基于三重映射 Sankey 图(TMSD)的文献计量研究。
Medicine (Baltimore). 2024 Jan 19;103(3):e36547. doi: 10.1097/MD.0000000000036547.

本文引用的文献

1
Visual impact beam plots: Analyzing research profiles and bibliometric metrics using the following-leading clustering algorithm (FLCA).视觉影响束图:使用以下领先聚类算法(FLCA)分析研究概况和文献计量指标。
Medicine (Baltimore). 2023 Jul 14;102(28):e34301. doi: 10.1097/MD.0000000000034301.
2
Analyzing the number of articles with network meta-analyses using chord diagrams and temporal heatmaps over the past 10 years: Bibliometric analysis.用和弦图和时间热图分析过去 10 年中网络荟萃分析文章的数量:文献计量分析。
Medicine (Baltimore). 2023 Jun 23;102(25):e34063. doi: 10.1097/MD.0000000000034063.
3
The ascendancy of research in acronyms related to COVID-19 displayed on a growth-share matrix (GSM): Bibliometric analysis.
COVID-19 相关缩略语研究的崛起在增长份额矩阵(GSM)上的表现:文献计量分析。
Medicine (Baltimore). 2023 Apr 25;102(17):e33626. doi: 10.1097/MD.0000000000033626.
4
A leading author of meta-analysis does not have a dominant contribution to research based on the CJAL score: Bibliometric analysis.一位主要的荟萃分析作者并没有根据 CJAL 评分对研究做出主导贡献:文献计量学分析。
Medicine (Baltimore). 2023 Apr 14;102(15):e33519. doi: 10.1097/MD.0000000000033519.
5
Analysis of citation trends to identify articles on delirium worth reading using DDPP model with temporal heatmaps (THM): A bibliometric analysis.基于 DDPP 模型的时间热图(THM)分析引用趋势,以识别值得阅读的谵妄相关文章:一项文献计量学分析。
Medicine (Baltimore). 2023 Feb 22;102(8):e32955. doi: 10.1097/MD.0000000000032955.
6
The model of descriptive, diagnostic, predictive, and prescriptive analytics on 100 top-cited articles of nasopharyngeal carcinoma from 2013 to 2022: Bibliometric analysis.2013 年至 2022 年 100 篇鼻咽癌高引文献的描述性、诊断性、预测性和规范性分析模型:文献计量分析。
Medicine (Baltimore). 2023 Feb 10;102(6):e32824. doi: 10.1097/MD.0000000000032824.
7
Using temporal heatmaps to identify worthwhile articles on immune checkpoint blockade for melanoma (ICBM) in Mainland China, Hong Kong, and Taiwan since 2000: A bibliometric analysis.使用时间热图来识别 2000 年以来中国大陆、香港和台湾地区关于黑色素瘤免疫检查点阻断(ICBM)的有价值文章:一项文献计量分析。
Medicine (Baltimore). 2023 Feb 3;102(5):e32797. doi: 10.1097/MD.0000000000032797.
8
A leading bibliometric author does not have a dominant contribution to research based on the CJAL score: Bibliometric analysis.一位领先的文献计量学作者在基于 CJAL 分数的研究中没有占主导地位的贡献:文献计量学分析。
Medicine (Baltimore). 2023 Jan 13;102(2):e32609. doi: 10.1097/MD.0000000000032609.
9
Citation trends in ophthalmology articles and keywords in mainland China, Hong Kong, and Taiwan since 2013 using temporal bar graphs (TBGs): Bibliometric analysis.2013 年以来中国大陆、香港和台湾地区眼科文献的引文趋势和关键词:时间条形图(TBG)的文献计量分析。
Medicine (Baltimore). 2022 Dec 30;101(52):e32392. doi: 10.1097/MD.0000000000032392.
10
The 100 most cited articles have fewer citations than other bibliometric articles: A pairwise comparison using a temporal bubble graph.100 篇最被引文章的被引次数少于其他文献计量文章:使用时间泡泡图进行的成对比较。
Medicine (Baltimore). 2022 Dec 2;101(48):e32101. doi: 10.1097/MD.0000000000032101.