• 文献检索
  • 文档翻译
  • 深度研究
  • 学术资讯
  • Suppr Zotero 插件Zotero 插件
  • 邀请有礼
  • 套餐&价格
  • 历史记录
应用&插件
Suppr Zotero 插件Zotero 插件浏览器插件Mac 客户端Windows 客户端微信小程序
定价
高级版会员购买积分包购买API积分包
服务
文献检索文档翻译深度研究API 文档MCP 服务
关于我们
关于 Suppr公司介绍联系我们用户协议隐私条款
关注我们

Suppr 超能文献

核心技术专利:CN118964589B侵权必究
粤ICP备2023148730 号-1Suppr @ 2026

文献检索

告别复杂PubMed语法,用中文像聊天一样搜索,搜遍4000万医学文献。AI智能推荐,让科研检索更轻松。

立即免费搜索

文件翻译

保留排版,准确专业,支持PDF/Word/PPT等文件格式,支持 12+语言互译。

免费翻译文档

深度研究

AI帮你快速写综述,25分钟生成高质量综述,智能提取关键信息,辅助科研写作。

立即免费体验

价值、兼容性和S值。

-value, compatibility, and S-value.

作者信息

Mansournia Mohammad Ali, Nazemipour Maryam, Etminan Mahyar

机构信息

Department of Epidemiology and Biostatistics, School of Public Health, Tehran University of Medical Sciences, Tehran, Iran.

Department of Ophthalmology, Medicine and Pharmacology, University of British Columbia, Vancouver, Canada.

出版信息

Glob Epidemiol. 2022 Sep 12;4:100085. doi: 10.1016/j.gloepi.2022.100085. eCollection 2022 Dec.

DOI:10.1016/j.gloepi.2022.100085
PMID:37637018
原文链接:https://pmc.ncbi.nlm.nih.gov/articles/PMC10446114/
Abstract

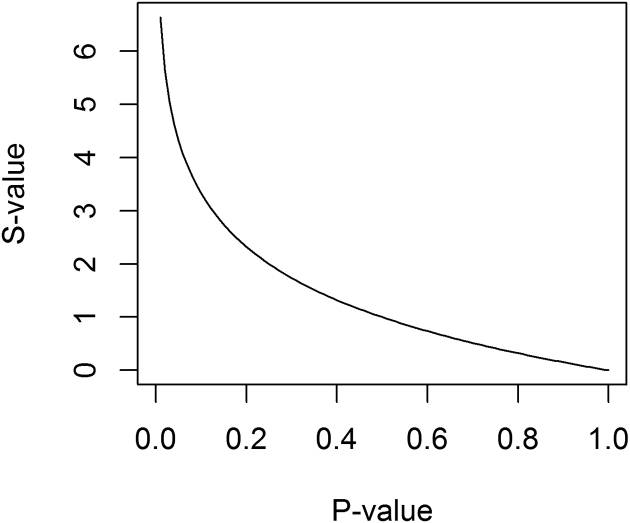
Misinterpretations of -values and 95% confidence intervals are ubiquitous in medical research. Specifically, the terms significance or confidence, extensively used in medical papers, ignore biases and violations of statistical assumptions and hence should be called overconfidence terms. In this paper, we present the compatibility view of -values and confidence intervals; the P-value is interpreted as an index of compatibility between data and the model, including the test hypothesis and background assumptions, whereas a confidence interval is interpreted as the range of parameter values that are compatible with the data under background assumptions. We also suggest the use of a surprisal measure, often referred to as the S-value, a novel metric that transforms the -value, for gauging compatibility in terms of an intuitive experiment of coin tossing.

摘要

在医学研究中,对P值和95%置信区间的误解无处不在。具体而言,医学论文中广泛使用的“显著性”或“置信度”等术语忽略了偏差和统计假设的违背,因此应被称为过度自信的术语。在本文中,我们提出了P值和置信区间的兼容性观点;P值被解释为数据与模型(包括检验假设和背景假设)之间的兼容性指标,而置信区间被解释为在背景假设下与数据兼容的参数值范围。我们还建议使用一种惊奇度量(通常称为S值),这是一种转换P值的新指标,用于通过抛硬币的直观实验来衡量兼容性。

https://cdn.ncbi.nlm.nih.gov/pmc/blobs/98ae/10446114/b8ed7b4677f3/gr1.jpg

相似文献

1
-value, compatibility, and S-value.价值、兼容性和S值。
Glob Epidemiol. 2022 Sep 12;4:100085. doi: 10.1016/j.gloepi.2022.100085. eCollection 2022 Dec.
2
Semantic and cognitive tools to aid statistical science: replace confidence and significance by compatibility and surprise.辅助统计科学的语义和认知工具:用兼容性和惊奇取代置信度和显著性。
BMC Med Res Methodol. 2020 Sep 30;20(1):244. doi: 10.1186/s12874-020-01105-9.
3
Multiple Confidence Intervals and Surprisal Intervals to Avoid Significance Fallacy.避免显著性谬误的多个置信区间和意外区间。
Cureus. 2024 Jan 9;16(1):e51964. doi: 10.7759/cureus.51964. eCollection 2024 Jan.
4
To curb research misreporting, replace significance and confidence by compatibility: A Preventive Medicine Golden Jubilee article.为了遏制研究报告错误,用兼容性替代显著性和置信度:预防医学金禧文章。
Prev Med. 2022 Nov;164:107127. doi: 10.1016/j.ypmed.2022.107127. Epub 2022 Jul 3.
5
Surprise!惊喜!
Am J Epidemiol. 2021 Feb 1;190(2):191-193. doi: 10.1093/aje/kwaa136.
6
A Framework to Avoid Significance Fallacy.避免显著性谬误的框架。
Cureus. 2023 Jun 11;15(6):e40242. doi: 10.7759/cureus.40242. eCollection 2023 Jun.
7
Statistical tests, P values, confidence intervals, and power: a guide to misinterpretations.统计检验、P 值、置信区间与检验效能:误解指南
Eur J Epidemiol. 2016 Apr;31(4):337-50. doi: 10.1007/s10654-016-0149-3. Epub 2016 May 21.
8
For a proper use of frequentist inferential statistics in public health.关于在公共卫生中正确使用频率学派推断统计学。
Glob Epidemiol. 2024 Jun 15;8:100151. doi: 10.1016/j.gloepi.2024.100151. eCollection 2024 Dec.
9
Use compatibility intervals in regulatory toxicology.在监管毒理学中使用兼容性区间。
Regul Toxicol Pharmacol. 2020 Oct;116:104720. doi: 10.1016/j.yrtph.2020.104720. Epub 2020 Jul 6.
10
Intellectual Disability After Gestational Exposure to Antidepressant Drugs: The Confidence Interval as a Compatibility Interval.妊娠期暴露于抗抑郁药后智力障碍:置信区间作为兼容性区间。
J Clin Psychiatry. 2019 May 28;80(3):19f12912. doi: 10.4088/JCP.19f12912.

引用本文的文献

1
Time-to-pregnancy in patients with previous breast cancer and unexposed women: a prospective exposed-unexposed cohort study.既往患乳腺癌患者与未接触过相关因素女性的受孕时间:一项前瞻性暴露-非暴露队列研究。
EClinicalMedicine. 2025 Jul 30;86:103392. doi: 10.1016/j.eclinm.2025.103392. eCollection 2025 Aug.
2
Why is p-Value Controversial?为什么p值存在争议?
Cardiovasc Intervent Radiol. 2025 Jul 22. doi: 10.1007/s00270-025-04139-y.
3
Optimizing early hip maturation strategies in neonatal hip immaturity and dysplasia: a cohort study and network meta-analysis.

本文引用的文献

1
A practical guide to handling competing events in etiologic time-to-event studies.病因性事件发生时间研究中处理竞争事件的实用指南。
Glob Epidemiol. 2022 Jul 11;4:100080. doi: 10.1016/j.gloepi.2022.100080. eCollection 2022 Dec.
2
To curb research misreporting, replace significance and confidence by compatibility: A Preventive Medicine Golden Jubilee article.为了遏制研究报告错误,用兼容性替代显著性和置信度:预防医学金禧文章。
Prev Med. 2022 Nov;164:107127. doi: 10.1016/j.ypmed.2022.107127. Epub 2022 Jul 3.
3
Interaction Contrasts and Collider Bias.
优化新生儿髋关节发育不成熟和发育异常的早期髋关节成熟策略:一项队列研究和网状Meta分析。
EClinicalMedicine. 2025 Jul 10;86:103344. doi: 10.1016/j.eclinm.2025.103344. eCollection 2025 Aug.
4
Deep learning for predicting invasive recurrence of ductal carcinoma in situ: leveraging histopathology images and clinical features.用于预测导管原位癌浸润性复发的深度学习:利用组织病理学图像和临床特征
EBioMedicine. 2025 Jun;116:105750. doi: 10.1016/j.ebiom.2025.105750. Epub 2025 May 28.
5
Circadian rhythm disruption by PARP inhibitors correlates with treatment toxicity in patients with ovarian cancer and is a predictor of side effects.聚(ADP - 核糖)聚合酶(PARP)抑制剂引起的昼夜节律紊乱与卵巢癌患者的治疗毒性相关,并且是副作用的一个预测指标。
EBioMedicine. 2025 May 16;117:105764. doi: 10.1016/j.ebiom.2025.105764.
6
Maternal socioeconomic status and early childhood growth and nutrition in the PERSIAN Birth Cohort with insights into the double burden of malnutrition.波斯出生队列研究中的母亲社会经济地位与幼儿生长发育及营养状况:对营养不良双重负担的洞察
Sci Rep. 2025 Apr 28;15(1):14893. doi: 10.1038/s41598-025-97619-7.
7
Subphenotypes and the De Ritis ratio for mortality risk stratification in sepsis-associated acute liver injury: a retrospective cohort study.脓毒症相关性急性肝损伤死亡率风险分层的亚表型及德瑞蒂斯比值:一项回顾性队列研究
EClinicalMedicine. 2025 Mar 27;82:103173. doi: 10.1016/j.eclinm.2025.103173. eCollection 2025 Apr.
8
Optimizing bone health in people living with HIV: insights from a network meta-analysis of randomized controlled trials.优化HIV感染者的骨骼健康:来自随机对照试验网络荟萃分析的见解
EClinicalMedicine. 2025 Feb 17;81:103103. doi: 10.1016/j.eclinm.2025.103103. eCollection 2025 Mar.
9
Influences of electrode density on intracranial seizure localisation: a single-blinded randomised crossover study.电极密度对颅内癫痫灶定位的影响:一项单盲随机交叉研究。
EBioMedicine. 2025 Mar;113:105606. doi: 10.1016/j.ebiom.2025.105606. Epub 2025 Mar 3.
10
Do more pregnancies increase the risk of periodontal disease?多次怀孕会增加患牙周病的风险吗?
F1000Res. 2025 Feb 6;13:1238. doi: 10.12688/f1000research.155151.2. eCollection 2024.
交互对比和碰撞器偏差。
Am J Epidemiol. 2022 Sep 28;191(10):1813-1819. doi: 10.1093/aje/kwac103.
4
Causal diagrams for immortal time bias.永存时间偏倚的因果图。
Int J Epidemiol. 2021 Nov 10;50(5):1405-1409. doi: 10.1093/ije/dyab157.
5
To Adjust or Not to Adjust: The Role of Different Covariates in Cardiovascular Observational Studies.是否调整:不同协变量在心血管观察性研究中的作用。
Am Heart J. 2021 Jul;237:62-67. doi: 10.1016/j.ahj.2021.03.008. Epub 2021 Mar 17.
6
CHecklist for statistical Assessment of Medical Papers: the CHAMP statement.医学论文统计评估清单:CHAMP声明
Br J Sports Med. 2021 Sep;55(18):1002-1003. doi: 10.1136/bjsports-2020-103651. Epub 2021 Jan 29.
7
A CHecklist for statistical Assessment of Medical Papers (the CHAMP statement): explanation and elaboration.用于医学论文统计评估的清单(CHAMP 声明):解释和说明。
Br J Sports Med. 2021 Sep;55(18):1009-1017. doi: 10.1136/bjsports-2020-103652. Epub 2021 Jan 29.
8
Semantic and cognitive tools to aid statistical science: replace confidence and significance by compatibility and surprise.辅助统计科学的语义和认知工具:用兼容性和惊奇取代置信度和显著性。
BMC Med Res Methodol. 2020 Sep 30;20(1):244. doi: 10.1186/s12874-020-01105-9.
9
Using Causal Diagrams to Improve the Design and Interpretation of Medical Research.使用因果关系图改进医学研究的设计与解读
Chest. 2020 Jul;158(1S):S21-S28. doi: 10.1016/j.chest.2020.03.011.
10
Surprise!惊喜!
Am J Epidemiol. 2021 Feb 1;190(2):191-193. doi: 10.1093/aje/kwaa136.