Division of Population Health, National Center for Chronic Disease Prevention and Health Promotion, Centers for Disease Control and Prevention, Atlanta, Georgia.
Centers for Disease Control and Prevention, 4770 Buford Hwy NE, Mailstop S107-6, Atlanta, GA 30341 (
Prev Chronic Dis. 2023 Aug 31;20:E76. doi: 10.5888/pcd20.230025.
Data are publicly available to identify geographic differences in health outcomes, including chronic obstructive pulmonary disease (COPD), and social vulnerability; however, examples of combining data across sources to understand disease burden in the context of community vulnerability are lacking.
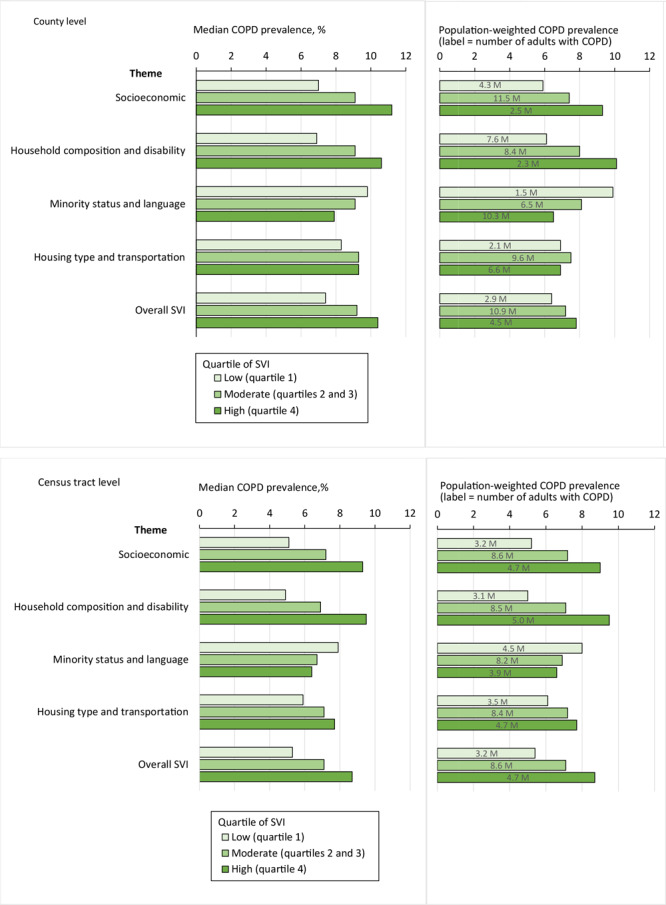
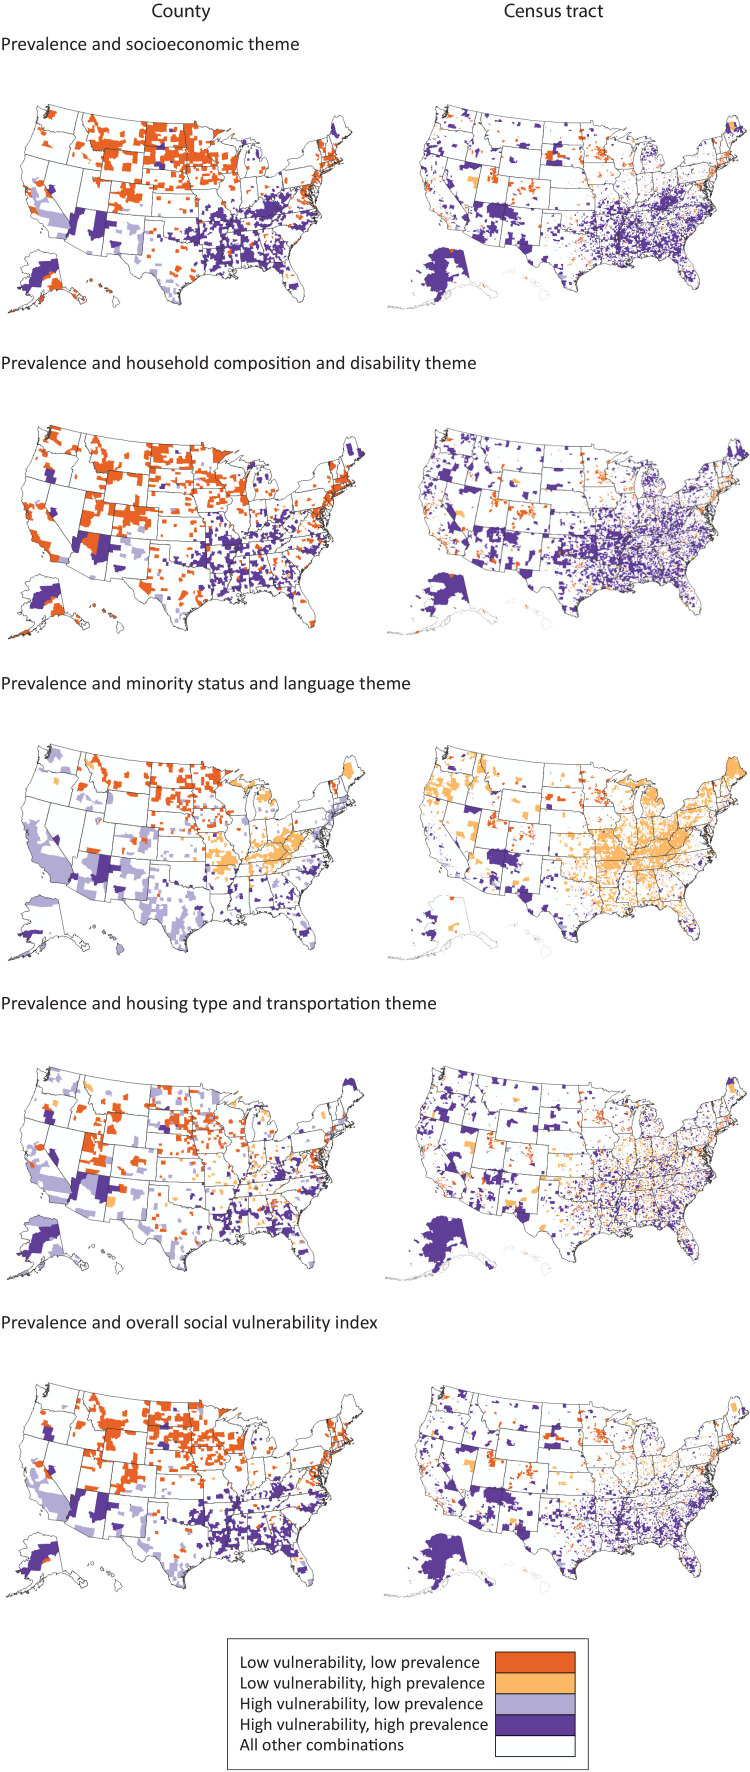
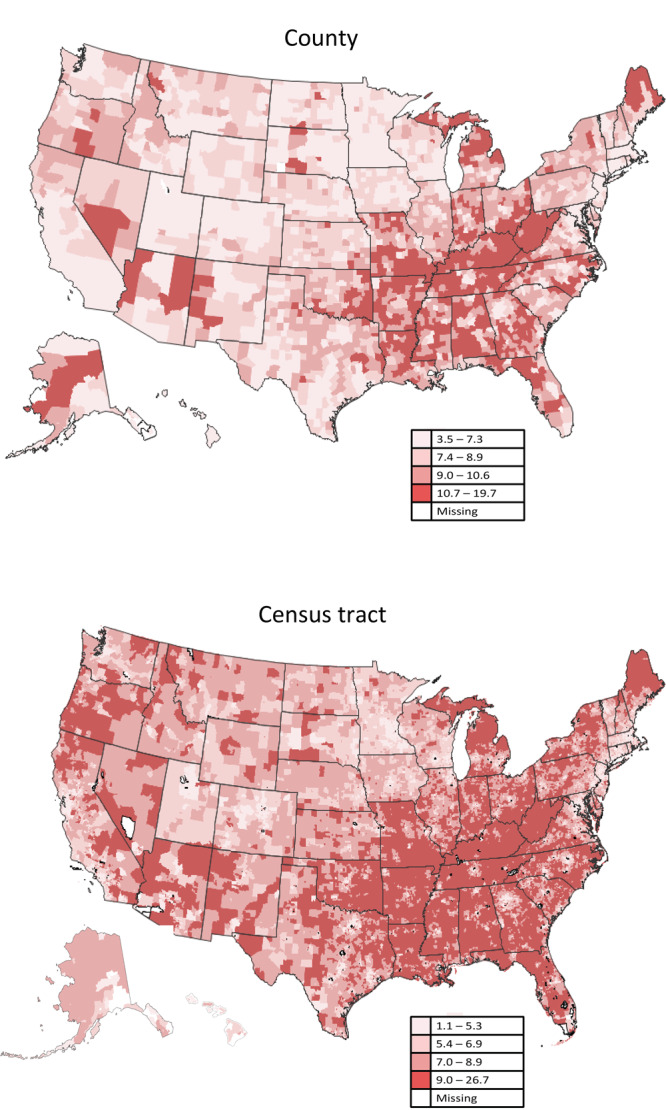
We merged county and census tract model-based estimates of COPD prevalence from PLACES (www.cdc.gov/PLACES) with social vulnerability measures from the Centers for Disease Control and Prevention/Agency for Toxic Substances and Disease Registry Social Vulnerability Index (https://www.atsdr.cdc.gov/placeandhealth/svi), including 4 themes (socioeconomic, household composition and disability, minority status and language, and housing type and transportation), and the overall Social Vulnerability Index (SVI). We used the merged data set to create vulnerability profiles by COPD prevalence, explore joint geographic patterns, and calculate COPD population estimates by vulnerability levels.
Counties and census tracts with high COPD prevalence (quartile 4) had high median vulnerability rankings (range: 0-1) for 2 themes: socioeconomic (county, 0.81; tract, 0.77) and household composition and disability (county, 0.75; tract, 0.81). Concordant high COPD prevalence and vulnerability for these themes were clustered along the Ohio and lower Mississippi rivers. The estimated number of adults with COPD residing in counties with high vulnerability was 2.5 million (tract: 4.7 million) for the socioeconomic theme and 2.3 million (tract: 5.0 million) for the household composition and disability theme (high overall SVI: county, 4.5 million; tract, 4.7 million).
Data from 2 publicly available tools can be combined, analyzed, and visualized to jointly examine local COPD estimates and social vulnerability. These analyses can be replicated with other measures to expand the use of these cross-cutting tools for public health planning.
数据可公开获取,以确定健康结果(包括慢性阻塞性肺疾病[COPD])和社会脆弱性方面的地理差异;但是,缺乏将数据结合起来了解社区脆弱性背景下疾病负担的示例。
我们将 PLACES(www.cdc.gov/PLACES)中基于县和普查区模型的 COPD 流行率估算值与疾病控制与预防中心/毒物和疾病登记处社会脆弱性指数(https://www.atsdr.cdc.gov/placeandhealth/svi)中的社会脆弱性措施合并,包括 4 个主题(社会经济、家庭构成和残疾、少数民族地位和语言以及住房类型和交通)以及总体社会脆弱性指数(SVI)。我们使用合并后的数据集创建基于 COPD 流行率的脆弱性概况,探索联合地理模式,并按脆弱性水平计算 COPD 人口估计。
COPD 流行率较高(四分位 4)的县和普查区在 2 个主题上具有较高的中位数脆弱性排名(范围:0-1):社会经济(县,0.81;区,0.77)和家庭构成和残疾(县,0.75;区,0.81)。这些主题中,COPD 流行率高和脆弱性高的地区沿着俄亥俄河和密西西比河下游聚集。在社会经济主题中,高脆弱性县中居住的患有 COPD 的成年人估计有 250 万人(区:470 万人),在家庭构成和残疾主题中,有 230 万人(区:500 万人)(高总体 SVI:县,450 万人;区,470 万人)。
可以合并、分析和可视化来自 2 个公开可用工具的数据,以共同检查局部 COPD 估计和社会脆弱性。可以使用其他措施复制这些分析,以扩大这些交叉工具在公共卫生规划中的使用。