• 文献检索
  • 文档翻译
  • 深度研究
  • 学术资讯
  • Suppr Zotero 插件Zotero 插件
  • 邀请有礼
  • 套餐&价格
  • 历史记录
应用&插件
Suppr Zotero 插件Zotero 插件浏览器插件Mac 客户端Windows 客户端微信小程序
定价
高级版会员购买积分包购买API积分包
服务
文献检索文档翻译深度研究API 文档MCP 服务
关于我们
关于 Suppr公司介绍联系我们用户协议隐私条款
关注我们

Suppr 超能文献

核心技术专利:CN118964589B侵权必究
粤ICP备2023148730 号-1Suppr @ 2026

文献检索

告别复杂PubMed语法,用中文像聊天一样搜索,搜遍4000万医学文献。AI智能推荐,让科研检索更轻松。

立即免费搜索

文件翻译

保留排版,准确专业,支持PDF/Word/PPT等文件格式,支持 12+语言互译。

免费翻译文档

深度研究

AI帮你快速写综述,25分钟生成高质量综述,智能提取关键信息,辅助科研写作。

立即免费体验

对 COVID-19 疫情反弹的“回到未来”预测。

"Back to the future" projections for COVID-19 surges.

机构信息

Division of Biostatistics, University of Minnesota, Minneapolis, Minnesota, United States of America.

Division of Biostatistics, University of Miami, Miami, Florida, United States of America.

出版信息

PLoS One. 2024 Jan 30;19(1):e0296964. doi: 10.1371/journal.pone.0296964. eCollection 2024.

DOI:10.1371/journal.pone.0296964
PMID:38289945
原文链接:https://pmc.ncbi.nlm.nih.gov/articles/PMC10826954/
Abstract

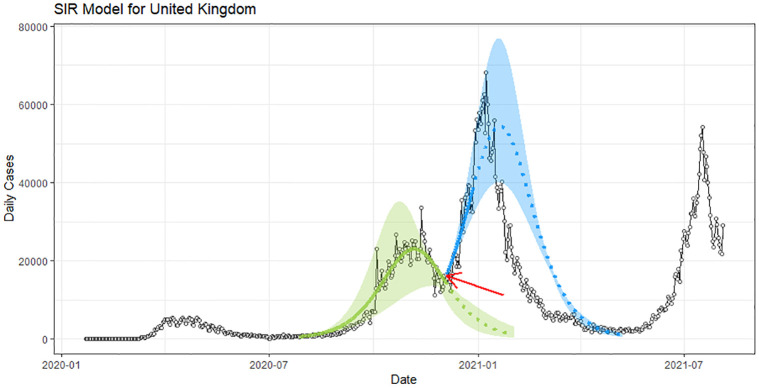
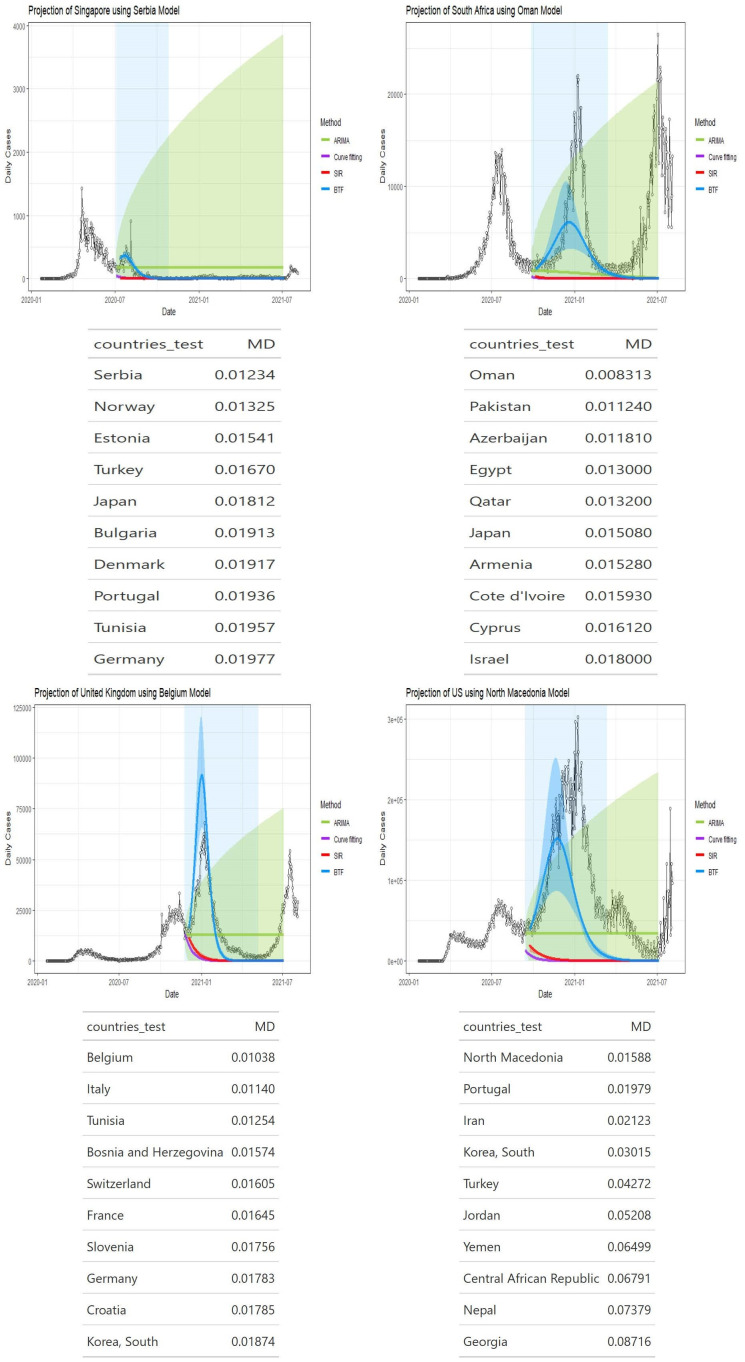
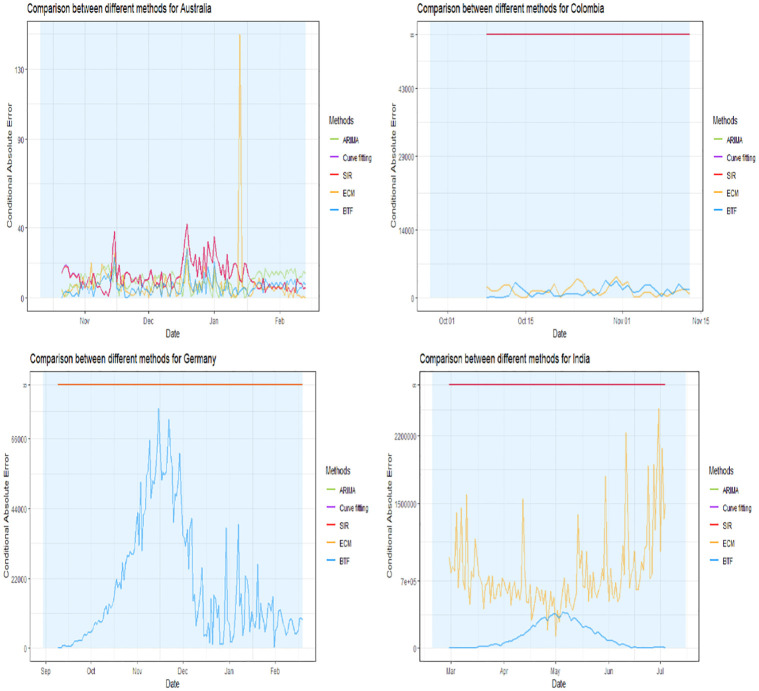
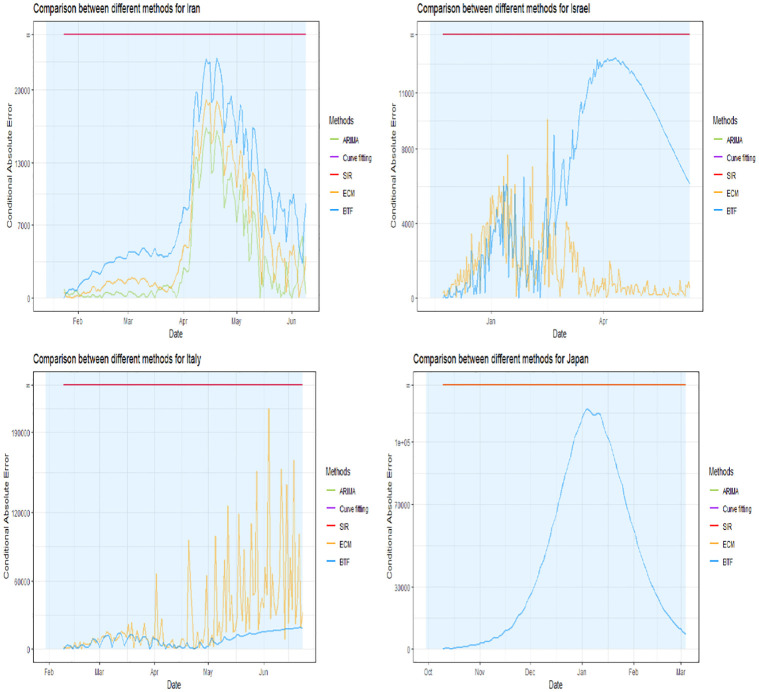
We argue that information from countries who had earlier COVID-19 surges can be used to inform another country's current model, then generating what we call back-to-the-future (BTF) projections. We show that these projections can be used to accurately predict future COVID-19 surges prior to an inflection point of the daily infection curve. We show, across 12 different countries from all populated continents around the world, that our method can often predict future surges in scenarios where the traditional approaches would always predict no future surges. However, as expected, BTF projections cannot accurately predict a surge due to the emergence of a new variant. To generate BTF projections, we make use of a matching scheme for asynchronous time series combined with a response coaching SIR model.

摘要

我们认为,来自先前 COVID-19 疫情爆发国家的信息可以用于为另一个国家的当前模型提供信息,从而产生我们所谓的“回溯未来”(BTF)预测。我们表明,这些预测可以在每日感染曲线的拐点之前,准确预测未来的 COVID-19 疫情爆发。我们展示了,在来自全球各大洲的 12 个不同国家中,我们的方法可以在传统方法总是预测没有未来疫情爆发的情况下,经常预测未来的疫情爆发。然而,正如预期的那样,由于新变体的出现,BTF 预测无法准确预测疫情爆发。为了生成 BTF 预测,我们使用异步时间序列的匹配方案和响应辅导 SIR 模型。

https://cdn.ncbi.nlm.nih.gov/pmc/blobs/71c6/10826954/80e9a84ebc11/pone.0296964.g007.jpg
https://cdn.ncbi.nlm.nih.gov/pmc/blobs/71c6/10826954/01ae0de185af/pone.0296964.g001.jpg
https://cdn.ncbi.nlm.nih.gov/pmc/blobs/71c6/10826954/2467efb72982/pone.0296964.g002.jpg
https://cdn.ncbi.nlm.nih.gov/pmc/blobs/71c6/10826954/46ca3176f3fc/pone.0296964.g003.jpg
https://cdn.ncbi.nlm.nih.gov/pmc/blobs/71c6/10826954/e8d179d5d879/pone.0296964.g004.jpg
https://cdn.ncbi.nlm.nih.gov/pmc/blobs/71c6/10826954/1bcf0def7879/pone.0296964.g005.jpg
https://cdn.ncbi.nlm.nih.gov/pmc/blobs/71c6/10826954/49ac3c856c86/pone.0296964.g006.jpg
https://cdn.ncbi.nlm.nih.gov/pmc/blobs/71c6/10826954/80e9a84ebc11/pone.0296964.g007.jpg

相似文献

1
"Back to the future" projections for COVID-19 surges.对 COVID-19 疫情反弹的“回到未来”预测。
PLoS One. 2024 Jan 30;19(1):e0296964. doi: 10.1371/journal.pone.0296964. eCollection 2024.
2
COVID-19 in Iran: clinical presentations and outcomes in three different surges of COVID-19 infection.伊朗的 COVID-19 疫情:三次不同 COVID-19 感染浪潮中的临床特征和结局。
Virol J. 2022 Jul 26;19(1):123. doi: 10.1186/s12985-022-01846-7.
3
Forecasting COVID-19 Hospital Census: A Multivariate Time-Series Model Based on Local Infection Incidence.预测 COVID-19 医院普查:基于局部感染发生率的多元时间序列模型。
JMIR Public Health Surveill. 2021 Aug 4;7(8):e28195. doi: 10.2196/28195.
4
An online time-to-event dashboard comparing the effective control of COVID-19 among continents using the inflection point on an ogive curve: Observational study.使用尖点在罗吉曲线比较各大陆 COVID-19 有效控制的在线时事件仪表板:观察性研究。
Medicine (Baltimore). 2021 Mar 12;100(10):e24749. doi: 10.1097/MD.0000000000024749.
5
Age-Stratified Infection Probabilities Combined With a Quarantine-Modified Model for COVID-19 Needs Assessments: Model Development Study.基于年龄分层感染概率和带有隔离修正的 COVID-19 需求评估模型:模型开发研究。
J Med Internet Res. 2021 May 31;23(5):e19544. doi: 10.2196/19544.
6
Evolution of Care and Outcomes Across Surges in Hospitalized Patients with Coronavirus Disease 2019.COVID-19 住院患者激增期间的护理和结局演变。
Am J Med. 2023 Jan;136(1):63-71.e1. doi: 10.1016/j.amjmed.2022.08.035. Epub 2022 Sep 21.
7
Projected resurgence of COVID-19 in the United States in July-December 2021 resulting from the increased transmissibility of the Delta variant and faltering vaccination.预计 2021 年 7 月至 12 月美国 COVID-19 病例将再次增多,原因是 Delta 变异株传染性增强和疫苗接种效果减弱。
Elife. 2022 Jun 21;11:e73584. doi: 10.7554/eLife.73584.
8
Separating signal from noise in wastewater data: An algorithm to identify community-level COVID-19 surges in real time.从废水数据中分离信号与噪声:实时识别社区层面 COVID-19 激增的算法。
Proc Natl Acad Sci U S A. 2023 Aug;120(31):e2216021120. doi: 10.1073/pnas.2216021120. Epub 2023 Jul 25.
9
Clinical characteristics and outcomes of SARS-Cov-2 B.1.1.529 infections in hospitalized patients and multi-surge comparison in Louisiana.在住院患者中感染 SARS-CoV-2 B.1.1.529 的临床特征和结果,以及路易斯安那州的多次激增比较。
PLoS One. 2022 Oct 21;17(10):e0268853. doi: 10.1371/journal.pone.0268853. eCollection 2022.
10
Trauma Prevalence and Resource Utilization During 4 COVID-19 "Surges": A National Analysis of Trauma Patients From 92 Trauma Centers.COVID-19 四次“浪潮”期间的创伤发生率和资源利用情况:92 家创伤中心创伤患者的全国性分析。
J Surg Res. 2022 Aug;276:208-220. doi: 10.1016/j.jss.2022.02.053. Epub 2022 Mar 14.

本文引用的文献

1
Correcting prevalence estimation for biased sampling with testing errors.校正存在检测误差的偏倚抽样中的患病率估计。
Stat Med. 2023 Nov 20;42(26):4713-4737. doi: 10.1002/sim.9885. Epub 2023 Sep 1.
2
Mathematical modelling of SARS-CoV-2 variant outbreaks reveals their probability of extinction.数学模型揭示了 SARS-CoV-2 变异株爆发的灭绝概率。
Sci Rep. 2021 Dec 30;11(1):24498. doi: 10.1038/s41598-021-04108-8.
3
Epidemic tracking and forecasting: Lessons learned from a tumultuous year.疫情追踪与预测:从动荡一年中汲取的经验教训。
Proc Natl Acad Sci U S A. 2021 Dec 21;118(51). doi: 10.1073/pnas.2111456118.
4
Short-term Covid-19 forecast for latecomers.针对后来者的新冠疫情短期预测。
Int J Forecast. 2022 Apr-Jun;38(2):467-488. doi: 10.1016/j.ijforecast.2021.09.013. Epub 2021 Oct 13.
5
Guidance for Implementing COVID-19 Prevention Strategies in the Context of Varying Community Transmission Levels and Vaccination Coverage.不同社区传播水平和疫苗接种率下实施 COVID-19 预防策略指南。
MMWR Morb Mortal Wkly Rep. 2021 Jul 27;70(30):1044-1047. doi: 10.15585/mmwr.mm7030e2.
6
On the accuracy of ARIMA based prediction of COVID-19 spread.基于自回归整合移动平均模型(ARIMA)的新冠肺炎传播预测的准确性
Results Phys. 2021 Aug;27:104509. doi: 10.1016/j.rinp.2021.104509. Epub 2021 Jul 15.
7
India's massive COVID surge puzzles scientists.印度新冠疫情的大规模激增令科学家们感到困惑。
Nature. 2021 Apr;592(7856):667-668. doi: 10.1038/d41586-021-01059-y.
8
A simple correction for COVID-19 sampling bias.一种简单的 COVID-19 采样偏差修正方法。
J Theor Biol. 2021 Mar 7;512:110556. doi: 10.1016/j.jtbi.2020.110556. Epub 2020 Dec 30.
9
A Review of Multi-Compartment Infectious Disease Models.多房室传染病模型综述
Int Stat Rev. 2020 Aug;88(2):462-513. doi: 10.1111/insr.12402. Epub 2020 Aug 3.
10
Generalized logistic growth modeling of the COVID-19 pandemic in Asia.亚洲新冠疫情的广义逻辑斯蒂增长模型
Infect Dis Model. 2020 Jul 24;5:502-509. doi: 10.1016/j.idm.2020.07.003. eCollection 2020.