Health Management Center, the First Affiliated Hospital of Zhengzhou University, Zhengzhou, China.
College of Public Health, Zhengzhou University, Zhengzhou, China.
Front Endocrinol (Lausanne). 2024 Feb 27;15:1321922. doi: 10.3389/fendo.2024.1321922. eCollection 2024.
The purpose of this manuscript is to identify longitudinal trajectories of changes in triglyceride glucose (TyG) index and investigate the association of TyG index trajectories with risk of lean nonalcoholic fatty liver disease (NAFLD).
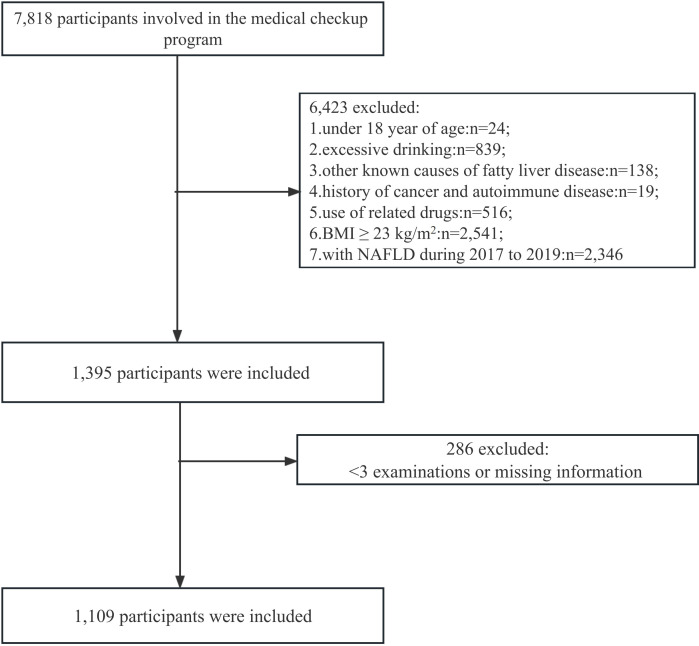
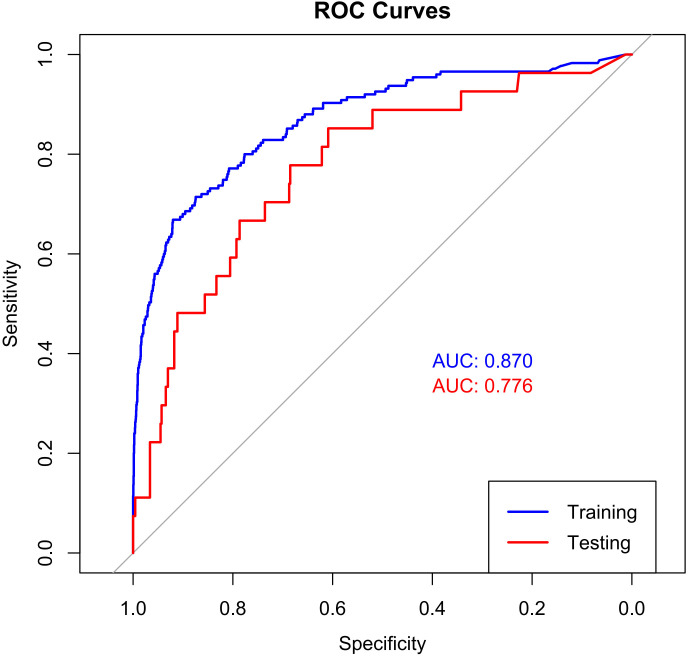
Using data from 1,109 participants in the Health Management Cohort longitudinal study, we used Latent Class Growth Modeling (LCGM) to develop TyG index trajectories. Using a Cox proportional hazard model, the relationship between TyG index trajectories and incident lean NAFLD was analyzed. Restricted cubic splines (RCS) were used to visually display the dose-response association between TyG index and lean NAFLD. We also deployed machine learning (ML) via Light Gradient Boosting Machine (LightGBM) to predict lean NAFLD, validated by receiver operating characteristic curves (ROCs). The LightGBM model was used to create an online tool for medical use. In addition, NAFLD was assessed by abdominal ultrasound after excluding other liver fat causes.
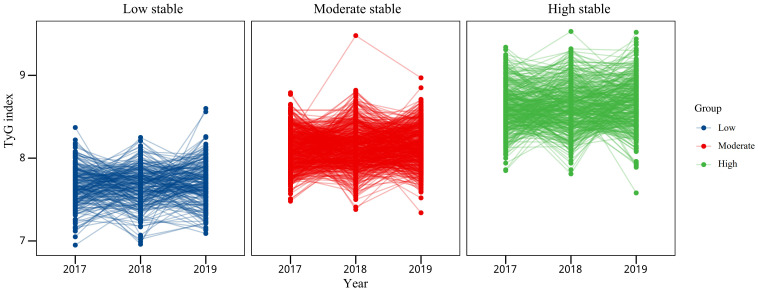
The median age of the population was 46.6 years, and 440 (39.68%) of the participants were men. Three distinct TyG index trajectories were identified: "low stable" (TyG index ranged from 7.66 to 7.71, n=206, 18.5%), "moderate stable" (TyG index ranged from 8.11 to 8.15, n=542, 48.8%), and "high stable" (TyG index ranged from 8.61 to 8.67, n=363, 32.7%). Using a "low stable" trajectory as a reference, a "high stable" trajectory was associated with an increased risk of lean-NAFLD (: 2.668, : 1.098-6.484). After adjusting for baseline age, WC, SBP, BMI, and ALT, HR increased slightly in "moderate stable" and "high stable" trajectories to 1.767 (:0.730-4.275) and 2.668 (:1.098-6.484), respectively. RCS analysis showed a significant nonlinear dose-response relationship between TyG index and lean NAFLD risk (11.5, =0.003). The LightGBM model demonstrated high accuracy (Train AUC 0.870, Test AUC 0.766). An online tool based on our model was developed to assist clinicians in assessing lean NAFLD risk.
The TyG index serves as a promising noninvasive marker for lean NAFLD, with significant implications for clinical practice and public health policy.
本研究旨在识别甘油三酯-葡萄糖(TyG)指数变化的纵向轨迹,并探讨 TyG 指数轨迹与非酒精性脂肪肝(NAFLD)风险的关系。
本研究使用来自 1109 名健康管理队列纵向研究参与者的数据,使用潜在类别增长模型(LCGM)来构建 TyG 指数轨迹。采用 Cox 比例风险模型分析 TyG 指数轨迹与瘦型非酒精性脂肪肝(lean NAFLD)发病的关系。采用限制性立方样条(RCS)直观显示 TyG 指数与瘦型 NAFLD 风险之间的剂量-反应关系。我们还通过 Light Gradient Boosting Machine(LightGBM)进行机器学习(ML),通过接收者操作特征曲线(ROC)进行验证。LightGBM 模型用于创建一个用于医疗用途的在线工具。此外,排除其他肝脏脂肪原因后,通过腹部超声评估 NAFLD。
人群的中位年龄为 46.6 岁,440 名(39.68%)参与者为男性。确定了三种不同的 TyG 指数轨迹:“低稳定”(TyG 指数范围为 7.66 至 7.71,n=206,18.5%)、“中稳定”(TyG 指数范围为 8.11 至 8.15,n=542,48.8%)和“高稳定”(TyG 指数范围为 8.61 至 8.67,n=363,32.7%)。以“低稳定”轨迹为参考,“高稳定”轨迹与瘦型-NAFLD 的发病风险增加相关(HR:2.668,95%CI:1.098-6.484)。在调整基线年龄、WC、SBP、BMI 和 ALT 后,“中稳定”和“高稳定”轨迹中的 HR 略有增加,分别为 1.767(95%CI:0.730-4.275)和 2.668(95%CI:1.098-6.484)。RCS 分析显示 TyG 指数与瘦型 NAFLD 风险之间存在显著的非线性剂量-反应关系(11.5,=0.003)。LightGBM 模型表现出较高的准确性(训练 AUC:0.870,测试 AUC:0.766)。基于我们的模型开发了一个在线工具,以帮助临床医生评估瘦型 NAFLD 风险。
TyG 指数是一种很有前途的非侵入性瘦型 NAFLD 标志物,对临床实践和公共卫生政策具有重要意义。