• 文献检索
  • 文档翻译
  • 深度研究
  • 学术资讯
  • Suppr Zotero 插件Zotero 插件
  • 邀请有礼
  • 套餐&价格
  • 历史记录
应用&插件
Suppr Zotero 插件Zotero 插件浏览器插件Mac 客户端Windows 客户端微信小程序
定价
高级版会员购买积分包购买API积分包
服务
文献检索文档翻译深度研究API 文档MCP 服务
关于我们
关于 Suppr公司介绍联系我们用户协议隐私条款
关注我们

Suppr 超能文献

核心技术专利:CN118964589B侵权必究
粤ICP备2023148730 号-1Suppr @ 2026

文献检索

告别复杂PubMed语法,用中文像聊天一样搜索,搜遍4000万医学文献。AI智能推荐,让科研检索更轻松。

立即免费搜索

文件翻译

保留排版,准确专业,支持PDF/Word/PPT等文件格式,支持 12+语言互译。

免费翻译文档

深度研究

AI帮你快速写综述,25分钟生成高质量综述,智能提取关键信息,辅助科研写作。

立即免费体验

孟加拉国湿球 globe 温度变化与热相关危害风险。

Changes in wet bulb globe temperature and risk to heat-related hazards in Bangladesh.

机构信息

Department of Disaster Science and Climate Resilience, University of Dhaka, Dhaka, 1000, Bangladesh.

Department of Water and Environmental Engineering, Faculty of Civil Engineering, Universiti Teknologi Malaysia, 81310, Johor Bahru, Malaysia.

出版信息

Sci Rep. 2024 May 6;14(1):10417. doi: 10.1038/s41598-024-61138-8.

DOI:10.1038/s41598-024-61138-8
PMID:38710893
原文链接:https://pmc.ncbi.nlm.nih.gov/articles/PMC11074116/
Abstract

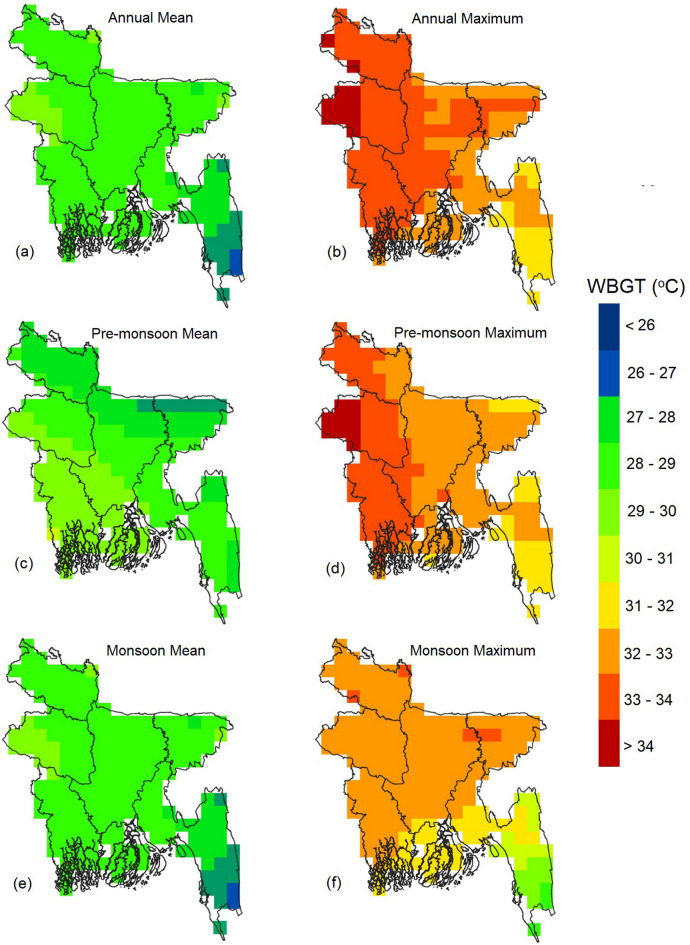
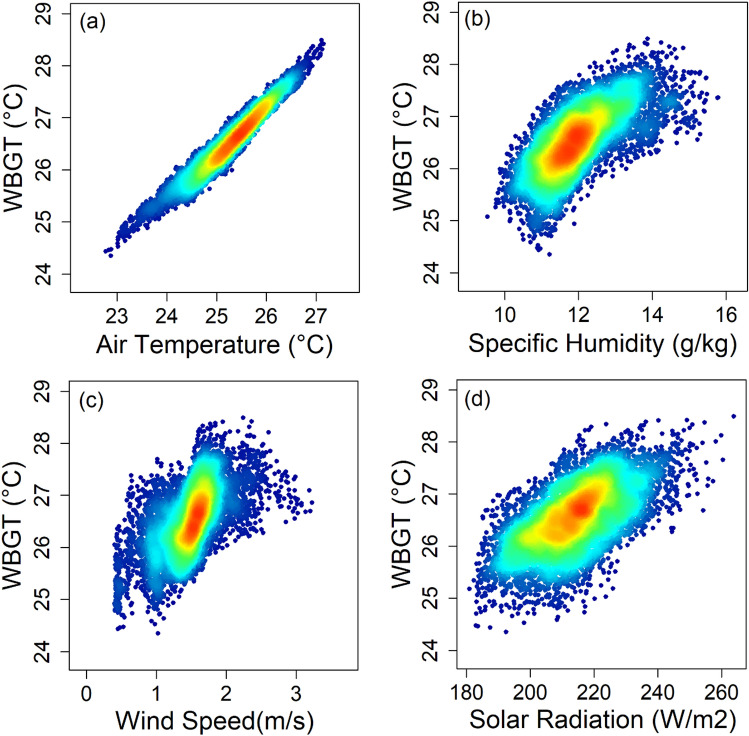
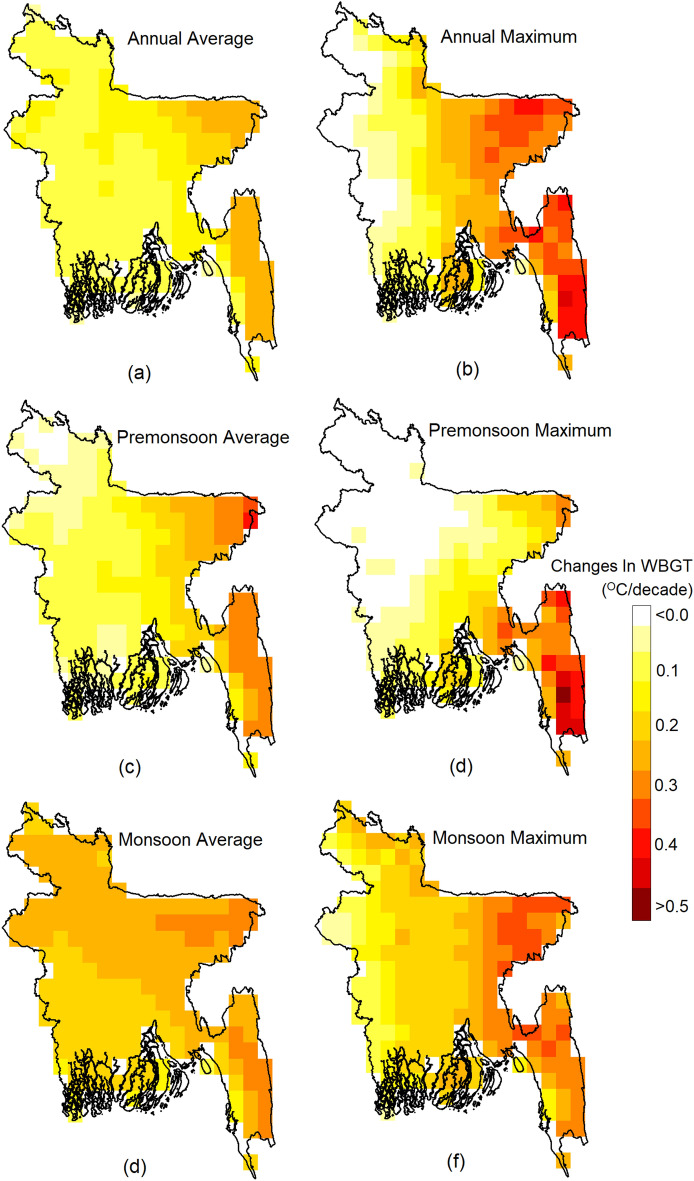
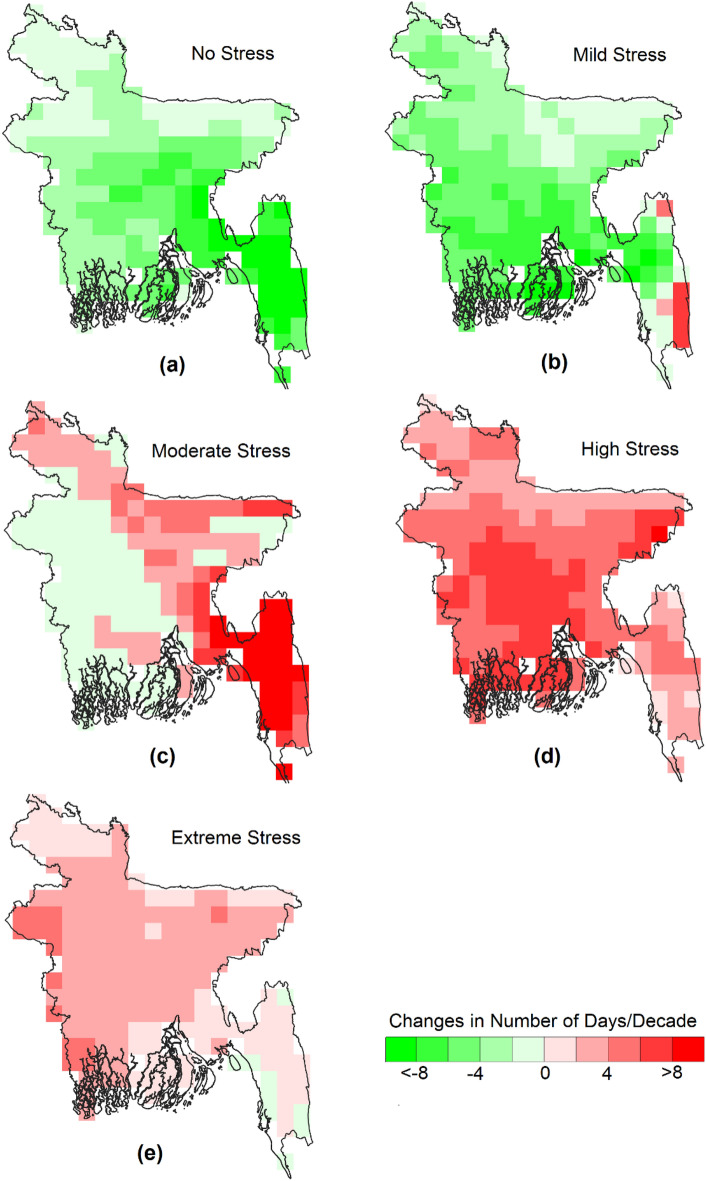
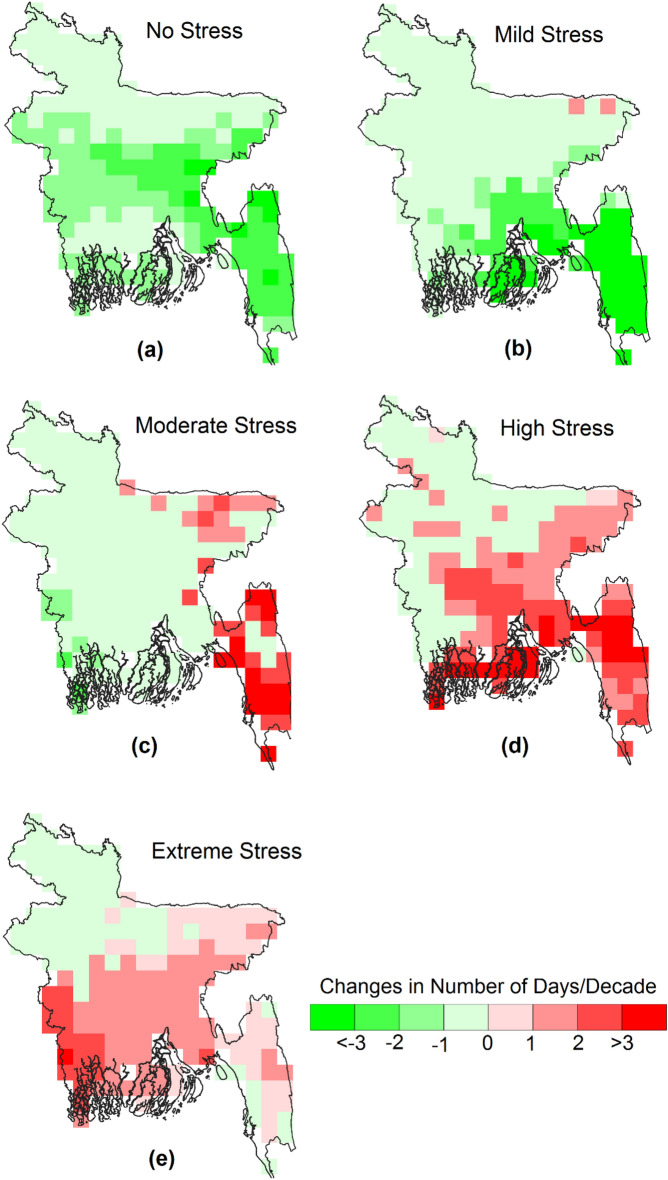
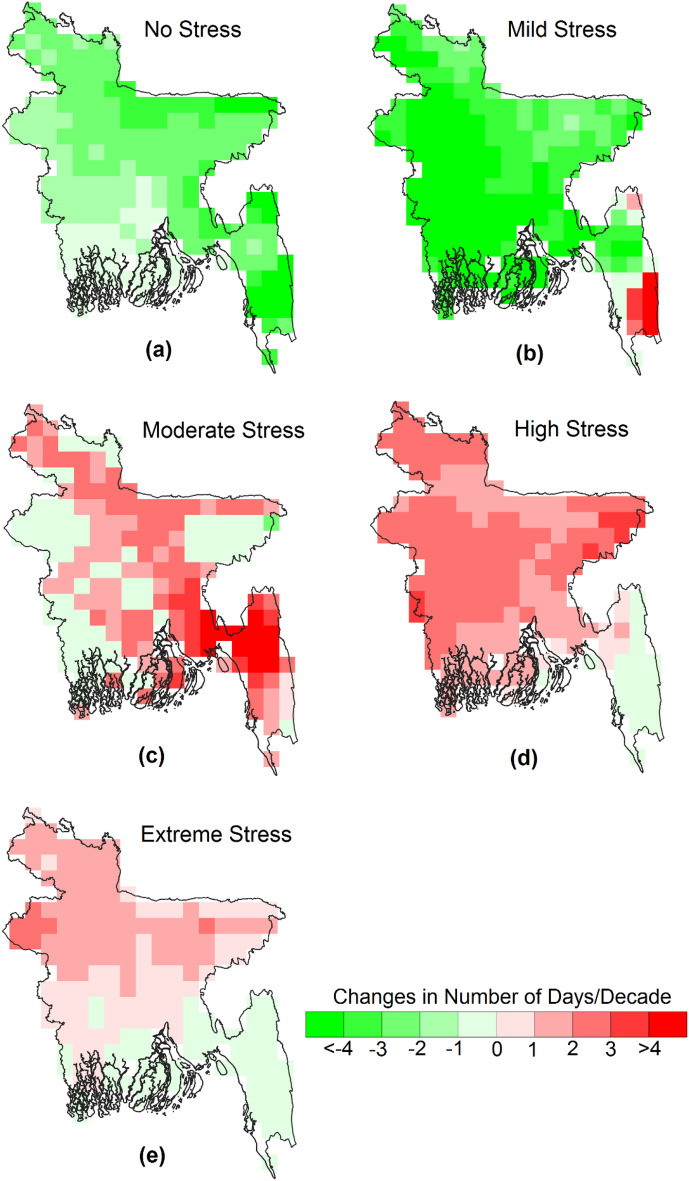
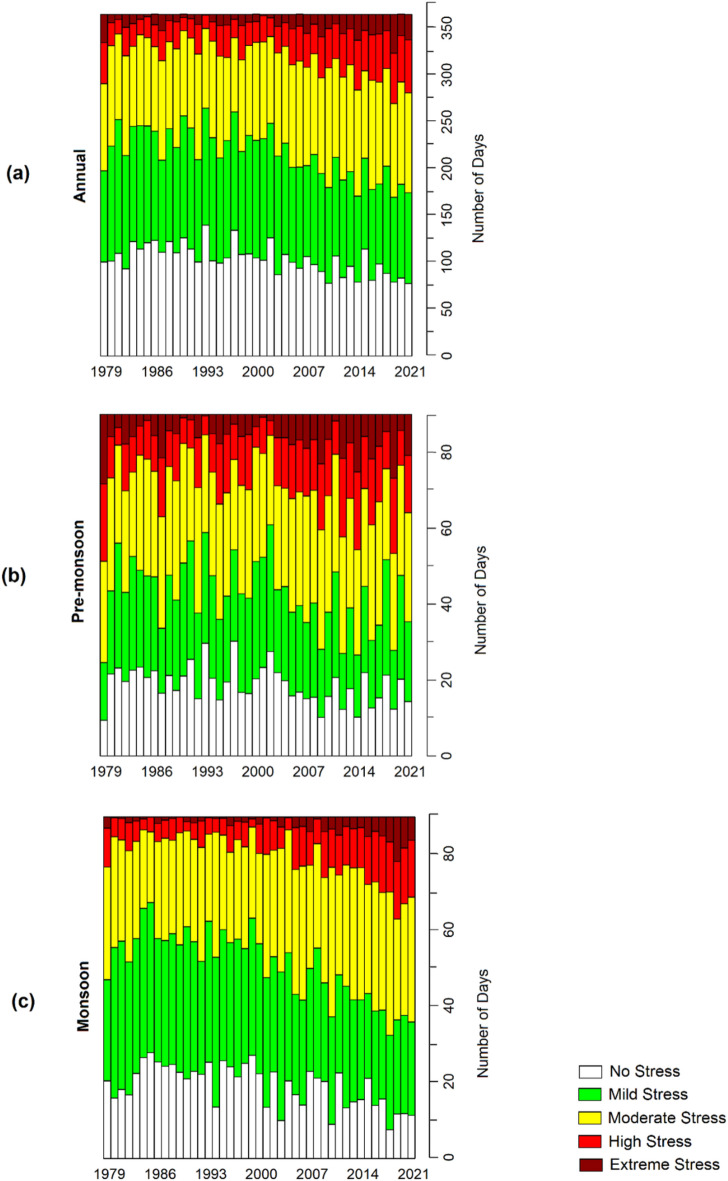
The rise in temperatures and changes in other meteorological variables have exposed millions of people to health risks in Bangladesh, a densely populated, hot, and humid country. To better assess the threats climate change poses to human health, the wet bulb globe temperature (WBGT) is an important indicator of human heat stress. This study utilized high-resolution reanalysis data from the fifth-generation European Centre for Medium-Range Weather Forecasts (ECMWF ERA5) to analyze the spatiotemporal changes in outdoor WBGT across Bangladesh from 1979 to 2021, employing Liljegren's model. The study revealed an increase in the annual average WBGT by 0.08-0.5 °C per decade throughout the country, with a more pronounced rise in the southeast and northeast regions. Additionally, the number of days with WBGT levels associated with high and extreme risks of heat-related illnesses has shown an upward trend. Specifically, during the monsoon period (June to September), there has been an increase of 2-4 days per decade, and during the pre-monsoon period (March to May), an increase of 1-3 days per decade from 1979 to 2021. Furthermore, the results indicated that the escalation in WBGT has led to a five-fold increase in affected areas and a three-fold increase in days of high and extreme heat stress during the monsoon season in recent years compared to the earlier period. Trend and relative importance analyses of various meteorological variables demonstrated that air temperature is the primary driver behind Bangladesh's rising WBGT and related health risks, followed by specific humidity, wind speed, and solar radiation.

摘要

气温上升和其他气象变量的变化使孟加拉国数以百万计的人面临健康风险,孟加拉国人口稠密,气候炎热潮湿。为了更好地评估气候变化对人类健康的威胁,湿球黑球温度(WBGT)是衡量人体热应激的一个重要指标。本研究利用第五代欧洲中期天气预报中心(ECMWF)高分辨率再分析数据,采用 Liljegren 模型,分析了 1979 年至 2021 年孟加拉国户外 WBGT 的时空变化。研究表明,全国范围内,WBGT 的年平均温度每十年升高 0.08-0.5°C,东南部和东北部地区的上升幅度更为明显。此外,WBGT 水平与高温相关疾病高风险和极端风险相关的天数呈上升趋势。具体而言,在季风期(6 月至 9 月),每十年增加 2-4 天,在季风前(3 月至 5 月),每十年增加 1-3 天。此外,结果表明,近年来,WBGT 的上升导致受影响地区增加了五倍,季风期的高温和极端高温天数增加了三倍,与早期相比。对各种气象变量的趋势和相对重要性分析表明,孟加拉国 WBGT 上升及相关健康风险的主要驱动因素是空气温度,其次是比湿、风速和太阳辐射。

https://cdn.ncbi.nlm.nih.gov/pmc/blobs/cff5/11074116/9900b983434c/41598_2024_61138_Fig8_HTML.jpg
https://cdn.ncbi.nlm.nih.gov/pmc/blobs/cff5/11074116/b41962d621db/41598_2024_61138_Fig1_HTML.jpg
https://cdn.ncbi.nlm.nih.gov/pmc/blobs/cff5/11074116/8aca01a84f79/41598_2024_61138_Fig2_HTML.jpg
https://cdn.ncbi.nlm.nih.gov/pmc/blobs/cff5/11074116/ed6b49322927/41598_2024_61138_Fig3_HTML.jpg
https://cdn.ncbi.nlm.nih.gov/pmc/blobs/cff5/11074116/9547b9ed7aff/41598_2024_61138_Fig4_HTML.jpg
https://cdn.ncbi.nlm.nih.gov/pmc/blobs/cff5/11074116/4a529b2ac4a0/41598_2024_61138_Fig5_HTML.jpg
https://cdn.ncbi.nlm.nih.gov/pmc/blobs/cff5/11074116/0e25369e8a53/41598_2024_61138_Fig6_HTML.jpg
https://cdn.ncbi.nlm.nih.gov/pmc/blobs/cff5/11074116/6046a0cf4e50/41598_2024_61138_Fig7_HTML.jpg
https://cdn.ncbi.nlm.nih.gov/pmc/blobs/cff5/11074116/9900b983434c/41598_2024_61138_Fig8_HTML.jpg

相似文献

1
Changes in wet bulb globe temperature and risk to heat-related hazards in Bangladesh.孟加拉国湿球 globe 温度变化与热相关危害风险。
Sci Rep. 2024 May 6;14(1):10417. doi: 10.1038/s41598-024-61138-8.
2
Comparison of methods for estimating Wet-Bulb Globe Temperature index from standard meteorological measurements.基于标准气象测量估算湿球温度指数的方法比较
Mil Med. 2013 Aug;178(8):926-33. doi: 10.7205/MILMED-D-13-00117.
3
Comparing the efficacy of different climate indices for prediction of labor loss, body temperatures, and thermal perception in a wide variety of warm and hot climates.比较不同气候指数在预测各种温暖和炎热气候下的劳动损失、体温和热感觉方面的功效。
J Appl Physiol (1985). 2024 Aug 1;137(2):312-328. doi: 10.1152/japplphysiol.00613.2023. Epub 2024 Jun 13.
4
Actual and simulated weather data to evaluate wet bulb globe temperature and heat index as alerts for occupational heat-related illness.用于评估湿球黑球温度和热指数以作为职业性热相关疾病警报的实际和模拟气象数据。
J Occup Environ Hyg. 2019 Jan;16(1):54-65. doi: 10.1080/15459624.2018.1532574. Epub 2019 Jan 28.
5
An Evaluation of Portable Wet Bulb Globe Temperature Monitor Accuracy.便携式湿球黑球温度监测器精度评估。
J Athl Train. 2017 Dec;52(12):1161-1167. doi: 10.4085/1062-6050-52.12.18. Epub 2017 Nov 20.
6
Variations in Athlete Heat-Loss Potential Between Hot-Dry and Warm-Humid Environments at Equivalent Wet-Bulb Globe Temperature Thresholds.在等效湿球 globe 温度阈值下,热干和暖湿环境中运动员热损失潜力的变化。
J Athl Train. 2020 Nov 1;55(11):1190-1198. doi: 10.4085/1062-6050-313-19.
7
Broad Scale Spatial Modelling of Wet Bulb Globe Temperature to Investigate Impact of Shade and Airflow on Heat Injury Risk and Labour Capacity in Warm to Hot Climates.大范围湿球黑球温度空间建模研究遮荫和气流对热环境中热损伤风险和劳动能力的影响。
Int J Environ Res Public Health. 2023 Aug 5;20(15):6531. doi: 10.3390/ijerph20156531.
8
Verifying Experimental Wet Bulb Globe Temperature Hindcasts Across the United States.验证美国各地实验湿球黑球温度后报数据
Geohealth. 2022 Apr 1;6(4):e2021GH000527. doi: 10.1029/2021GH000527. eCollection 2022 Apr.
9
Assessment of Heat Stress Exposure among Construction Workers in the Hot Desert Climate of Saudi Arabia.评估沙特阿拉伯炎热沙漠气候下建筑工人的热应激暴露情况。
Ann Work Expo Health. 2019 May 21;63(5):505-520. doi: 10.1093/annweh/wxz033.
10
Global Heat Wave Hazard Considering Humidity Effects during the 21st Century.考虑到 21 世纪湿度影响的全球热浪危害。
Int J Environ Res Public Health. 2019 Apr 29;16(9):1513. doi: 10.3390/ijerph16091513.

引用本文的文献

1
Association between wet-bulb globe temperature with peptic ulcer disease in different geographic regions in a large Taiwanese population study.在一项大型台湾人群研究中不同地理区域湿球黑球温度与消化性溃疡病之间的关联
BMC Gastroenterol. 2025 Apr 2;25(1):216. doi: 10.1186/s12876-025-03803-4.
2
Racial and Economic Disparities in High-Temperature Exposure in Brazil.巴西高温暴露方面的种族和经济差异。
Int J Environ Res Public Health. 2025 Jan 30;22(2):200. doi: 10.3390/ijerph22020200.
3
Exceeding the limits of paediatric heat stress tolerance: the risk of losing a generation to climate inaction.

本文引用的文献

1
Wet Bulb Globe Temperature: Indicating Extreme Heat Risk on a Global Grid.湿球黑球温度:在全球网格上指示极端高温风险。
Geohealth. 2023 Feb 20;7(2):e2022GH000701. doi: 10.1029/2022GH000701. eCollection 2023 Feb.
2
Wet-Bulb Globe Temperature, Universal Thermal Climate Index, and Other Heat Metrics for US Counties, 2000-2020.湿球 globe 温度、通用热气候指数及美国各县 2000-2020 年的其他热指标
Sci Data. 2022 Jun 17;9(1):326. doi: 10.1038/s41597-022-01405-3.
3
Verifying Experimental Wet Bulb Globe Temperature Hindcasts Across the United States.
超越儿童热应激耐受极限:因气候行动不力而失去一代人的风险。
BMJ Paediatr Open. 2025 Jan 21;9(1):e002883. doi: 10.1136/bmjpo-2024-002883.
验证美国各地实验湿球黑球温度后报数据
Geohealth. 2022 Apr 1;6(4):e2021GH000527. doi: 10.1029/2021GH000527. eCollection 2022 Apr.
4
Intensity-duration-frequency relationship of WBGT extremes using regional frequency analysis in South Korea.韩国地区频率分析的 WBGT 极值强度-持续时间-频率关系
Environ Res. 2020 Nov;190:109964. doi: 10.1016/j.envres.2020.109964. Epub 2020 Jul 31.
5
Prevalence and associated risk factors of general and abdominal obesity in rural and urban women in Bangladesh.孟加拉国农村和城市女性普遍和腹部肥胖的流行情况及其相关危险因素。
PLoS One. 2020 May 29;15(5):e0233754. doi: 10.1371/journal.pone.0233754. eCollection 2020.
6
Heat wave trends in Southeast Asia during 1979-2018: The impact of humidity.1979-2018 年东南亚热浪趋势:湿度的影响。
Sci Total Environ. 2020 Jun 15;721:137664. doi: 10.1016/j.scitotenv.2020.137664. Epub 2020 Mar 5.
7
Patterns of outdoor exposure to heat in three South Asian cities.三种南亚城市的户外热暴露模式。
Sci Total Environ. 2019 Jul 15;674:264-278. doi: 10.1016/j.scitotenv.2019.04.087. Epub 2019 Apr 9.
8
New approach to identifying proper thresholds for a heat warning system using health risk increments.使用健康风险增量确定热警报系统适当阈值的新方法。
Environ Res. 2019 Mar;170:282-292. doi: 10.1016/j.envres.2018.12.059. Epub 2018 Dec 26.
9
The effects of ambient temperatures on the risk of work-related injuries and illnesses: Evidence from Adelaide, Australia 2003-2013.环境温度对工作相关伤害和疾病风险的影响:来自澳大利亚阿德莱德 2003-2013 年的证据。
Environ Res. 2019 Mar;170:101-109. doi: 10.1016/j.envres.2018.12.024. Epub 2018 Dec 13.
10
Assessment of heat exposure in cities: Combining the dynamics of temperature and population.城市热暴露评估:温度与人口动态的结合。
Sci Total Environ. 2019 Mar 10;655:1-12. doi: 10.1016/j.scitotenv.2018.11.028. Epub 2018 Nov 7.