Amin Erum, Tariq Anum, Nawaz Ramsha, Tariq Alaina, Gul Bushra
Orthodontics, Armed Forces Institute of Dentistry, Rawalpindi, PAK.
Cureus. 2024 Aug 25;16(8):e67761. doi: 10.7759/cureus.67761. eCollection 2024 Aug.
Soft tissue analysis can be used to assess anatomical features but may or may not accurately correlate with underlying hard tissue morphology, leading to an incorrect perception of malocclusion.
This study aimed to assess the reliability of different soft tissue reference lines used to evaluate anteroposterior lip position and the position of incisors and malocclusion and compare it with those assessed via hard tissue angles (LSMx and LIMd) and determine if they are true indicators of underlying protrusion of incisors and malocclusion.
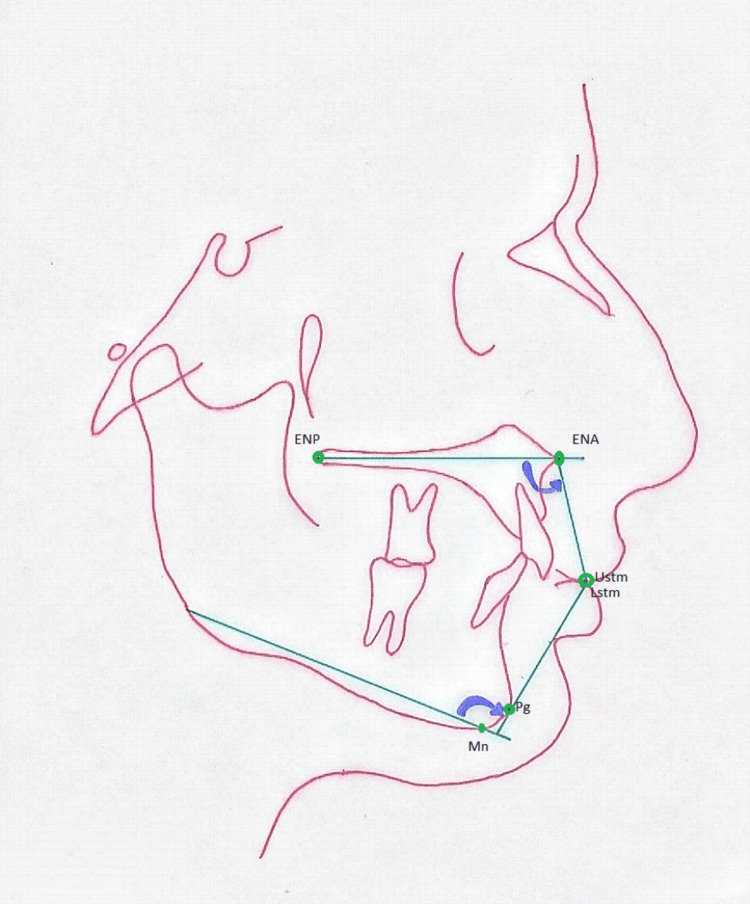
A total of 120 pre-treatment lateral cephalometric radiographs were selected where patients were 18-30 years old, diagnosed as Skeletal Class I, II (Division 1 and 2), and III malocclusion. The measurements taken were SN to point A angle (SNA), SN to point B angle (SNB), angle between point A and point B (ANB), upper incisor to SN plane angle (UI-SN), upper incisor to palatal plane angle (UI-PP), incisor mandibular plane angle (IMPA), Ricketts' E line, Sushner's S2 line, nasolabial (NL) angle, mentolabial (ML) angle, LSMx angle, and LIMd angle.
In the Class I malocclusion group, when the upper lip was assessed, the distribution of UI-SN, UI-PP, E line to UL, S line to UL, NL angle, and LMax was significantly different statistically (p=0.000), though the assessment of lower variables in Class I malocclusion showed the distribution of IMPA, E line to UL, S line to UL, ML angle, and LMand angle has a statistically significant difference (p=0.007). In Class II Division 2 malocclusion, a significant difference was observed for the upper variables (p=0.000), whereas the distribution of lower values was the same across all the variables (p=0.0724). In the sample of Class III malocclusion, a significant correlation was found in the upper variables, while the distribution among lower variables did not show any significant difference (p=0.211).
This study indicates that the upper and lower soft tissue correlation with hard tissue variables is reliable for some variables but not throughout for all. Soft tissue analysis (under study) can be used to assess disproportion, but it fails to correlate to the underlying hard tissue morphology and does not explain the correct malocclusion. Further studies based on 3D diagnosis to formulate a close relationship are encouraged that can help assess soft and hard tissue patterns consistent with one another.
软组织分析可用于评估解剖特征,但可能准确或不准确地与潜在的硬组织形态相关联,从而导致对错颌畸形的错误认知。
本研究旨在评估用于评估前后唇位置、切牙位置和错颌畸形的不同软组织参考线的可靠性,并将其与通过硬组织角度(LSMx和LIMd)评估的结果进行比较,以确定它们是否是切牙潜在前突和错颌畸形的真实指标。
共选取120张治疗前的头颅侧位X线片,患者年龄在18至30岁之间,诊断为骨骼I类、II类(1分类和2分类)和III类错颌畸形。测量的指标包括SN至A点角(SNA)、SN至B点角(SNB)、A点与B点之间的角(ANB)、上切牙至SN平面角(UI-SN)、上切牙至腭平面角(UI-PP)、切牙下颌平面角(IMPA)、里克茨E线、苏什纳S2线、鼻唇(NL)角、颏唇(ML)角、LSMx角和LIMd角。
在I类错颌畸形组中,评估上唇时,UI-SN、UI-PP、E线至UL、S线至UL、NL角和LMax的分布在统计学上有显著差异(p = 0.000),尽管I类错颌畸形中较低变量的评估显示IMPA、E线至UL、S线至UL、ML角和LMand角的分布有统计学显著差异(p = 0.007)。在II类2分类错颌畸形中,上变量观察到显著差异(p = 0.000),而所有变量中较低值的分布相同(p = 0.0724)。在III类错颌畸形样本中,上变量发现有显著相关性,而较低变量之间的分布没有显示出任何显著差异(p = 0.211)。
本研究表明,上下软组织与硬组织变量之间的相关性对于某些变量是可靠的,但并非对所有变量都始终可靠。软组织分析(正在研究中)可用于评估比例失调,但它与潜在的硬组织形态不相关,也无法解释正确的错颌畸形。鼓励基于三维诊断进行进一步研究,以建立密切关系,这有助于评估相互一致的软硬组织模式。