Kane Laura E, Mellotte Gregory S, Mylod Eimear, Dowling Paul, Marcone Simone, Scaife Caitriona, Kenny Elaine M, Henry Michael, Meleady Paula, Ridgway Paul F, MacCarthy Finbar, Conlon Kevin C, Ryan Barbara M, Maher Stephen G
Department of Surgery, Trinity St. James's Cancer Institute, Trinity Translational Medicine Institute, Trinity College Dublin, St. James's Hospital, Dublin 8, Ireland.
Department of Gastroenterology, Tallaght University Hospital, Dublin 24, Ireland.
Sci Rep. 2025 Jan 2;15(1):129. doi: 10.1038/s41598-024-83742-4.
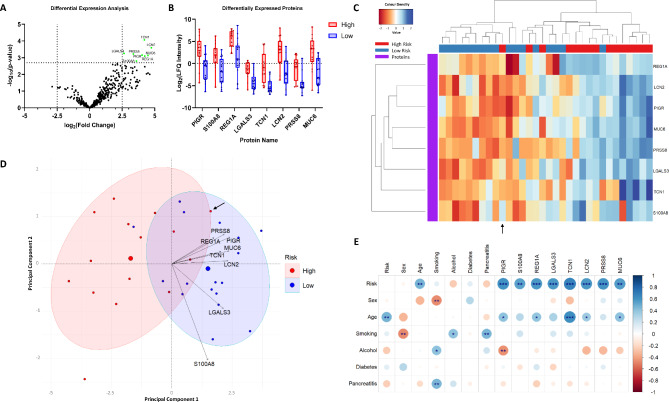
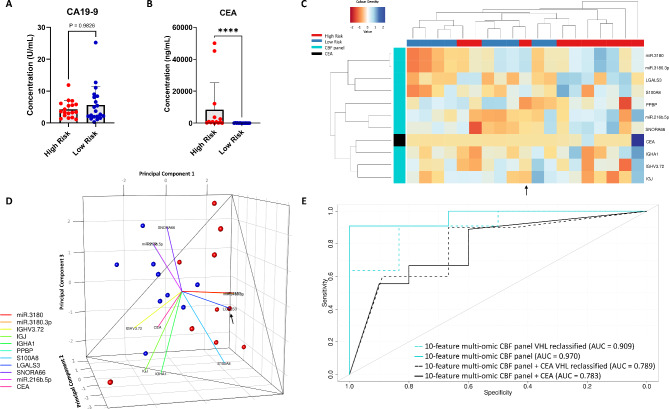
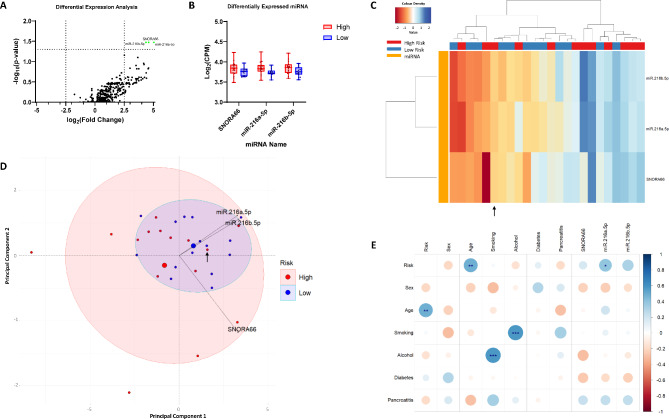
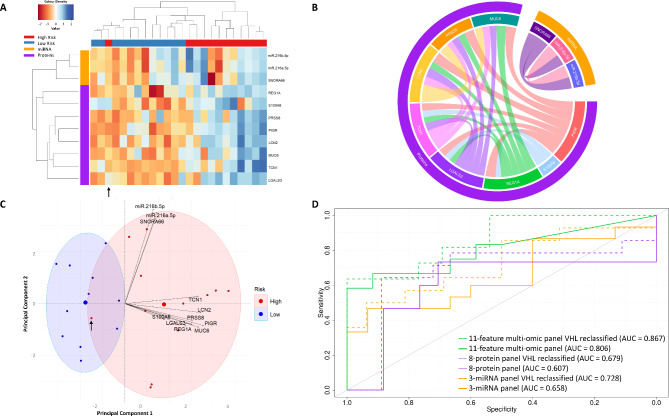
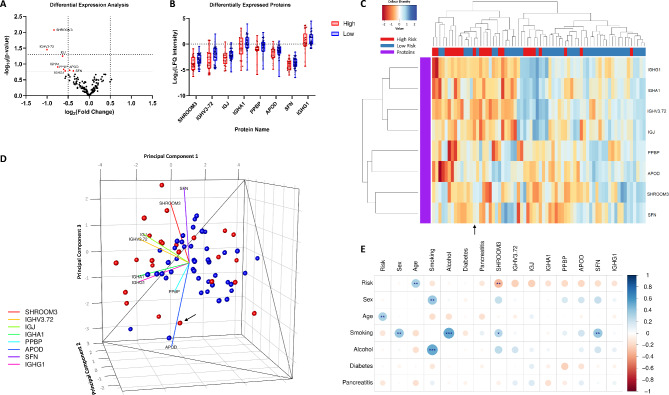
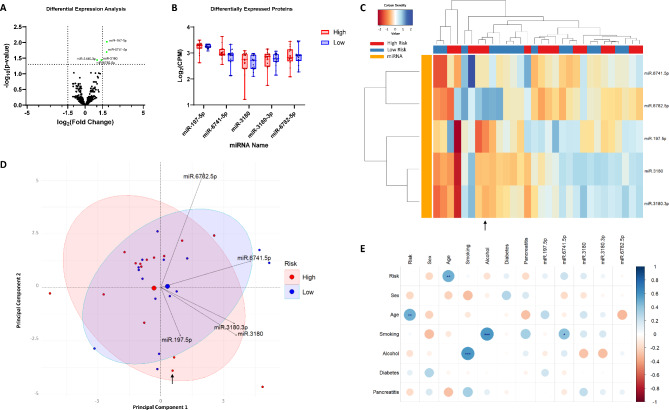
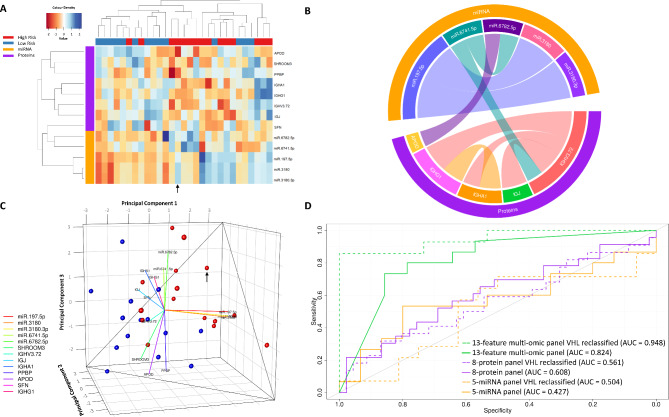
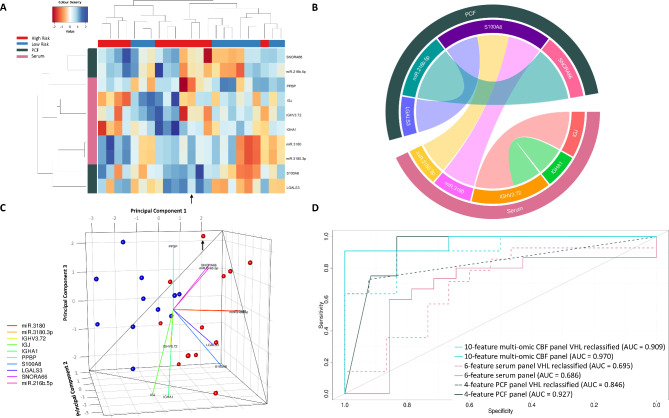
Integration of multi-omic data for the purposes of biomarker discovery can provide novel and robust panels across multiple biological compartments. Appropriate analytical methods are key to ensuring accurate and meaningful outputs in the multi-omic setting. Here, we extensively profile the proteome and transcriptome of patient pancreatic cyst fluid (PCF) (n = 32) and serum (n = 68), before integrating matched omic and biofluid data, to identify biomarkers of pancreatic cancer risk. Differential expression analysis, feature reduction, multi-omic data integration, unsupervised hierarchical clustering, principal component analysis, spearman correlations and leave-one-out cross-validation were performed using RStudio and CombiROC software. An 11-feature multi-omic panel in PCF [PIGR, S100A8, REG1A, LGALS3, TCN1, LCN2, PRSS8, MUC6, SNORA66, miR-216a-5p, miR-216b-5p] generated an AUC = 0.806. A 13-feature multi-omic panel in serum [SHROOM3, IGHV3-72, IGJ, IGHA1, PPBP, APOD, SFN, IGHG1, miR-197-5p, miR-6741-5p, miR-3180, miR-3180-3p, miR-6782-5p] produced an AUC = 0.824. Integration of the strongest performing biomarkers generated a 10-feature cross-biofluid multi-omic panel [S100A8, LGALS3, SNORA66, miR-216b-5p, IGHV3-72, IGJ, IGHA1, PPBP, miR-3180, miR-3180-3p] with an AUC = 0.970. Multi-omic profiling provides an abundance of potential biomarkers. Integration of data from different omic compartments, and across biofluids, produced a biomarker panel that performs with high accuracy, showing promise for the risk stratification of patients with pancreatic cystic lesions.
为发现生物标志物而整合多组学数据,可为多个生物区室提供新颖且可靠的指标组合。合适的分析方法是确保在多组学环境下获得准确且有意义结果的关键。在此,我们在整合匹配的组学和生物流体数据之前,对患者胰腺囊肿液(PCF)(n = 32)和血清(n = 68)的蛋白质组和转录组进行了广泛分析,以识别胰腺癌风险的生物标志物。使用RStudio和CombiROC软件进行差异表达分析、特征约简、多组学数据整合、无监督层次聚类、主成分分析、斯皮尔曼相关性分析和留一法交叉验证。PCF中的一个11特征多组学指标组合[PIGR、S100A8, REG1A、LGALS3、TCN1、LCN2、PRSS8、MUC6、SNORA66、miR - 216a - 5p、miR - 216b - 5p]的曲线下面积(AUC)= 0.806。血清中的一个13特征多组学指标组合[SHROOM3、IGHV3 - 72、IGJ、IGHA1、PPBP、APOD、SFN、IGHG1、miR - 197 - 5p、miR - 6741 - 5p、miR - 31,80、miR - 3180 - 3p、miR - 6782 - 5p]的AUC = 0.824。整合表现最强的生物标志物产生了一个10特征跨生物流体多组学指标组合[S100A8、LGALS3、SNORA66、miR - 216b - 5p、IGHV3 - 72、IGJ、IGHA1、PPBP、miR - 3180、miR - 3180 - 3p],其AUC = 0.970。多组学分析提供了大量潜在的生物标志物。整合来自不同组学区室以及跨生物流体的数据,产生了一个具有高精度的生物标志物指标组合,显示出在胰腺囊性病变患者风险分层方面的前景。