Guo Tingting, Zou Qing, Wang Qi, Zhang Yi, Zhong Xinyuan, Lin Hantong, Gong Wenxuan, Wang Yingbo, Xie Kun, Wu Kunpeng, Chen Feng, Chen Wen
Department of Medical Statistics, School of Public Health, Sun Yat-sen University, 74 Zhongshan Second Rd, Guangzhou 510080, China.
Department of Clinical Research, The Eighth Affiliated Hospital, Sun Yat-sen University, 3025 Shennan Zhong Rd, Shenzhen 518033, China.
Nutrients. 2024 Dec 12;16(24):4300. doi: 10.3390/nu16244300.
To explore whether the triglyceride-glucose (TyG) index and the triglyceride to high-density lipoprotein cholesterol (TG/HDL-C) ratio are associated with the trajectories of depressive symptoms.
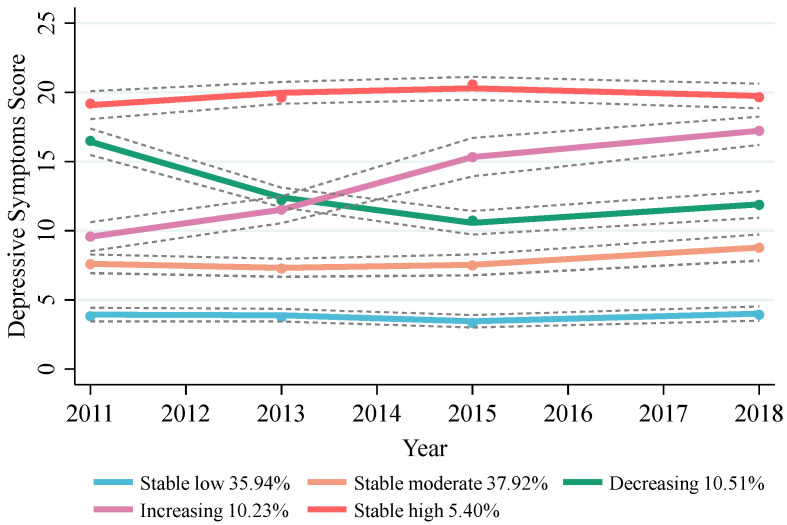
In this longitudinal study, 4215 participants aged 45 years and older were recruited from the China Health and Retirement Longitudinal Study from 2011 to 2018. The trajectories of depressive symptoms, measured by the 10-item Center for Epidemiologic Studies Depression Scale (CESD-10), were identified using group-based trajectory modeling. Multinomial logistic models and restricted cubic spline analysis were used to investigate the relationships between the TyG index and the TG/HDL-C ratio and the trajectories of depressive symptoms. Stratified analyses were conducted based on sex, age, place of residence, and body mass index (BMI).
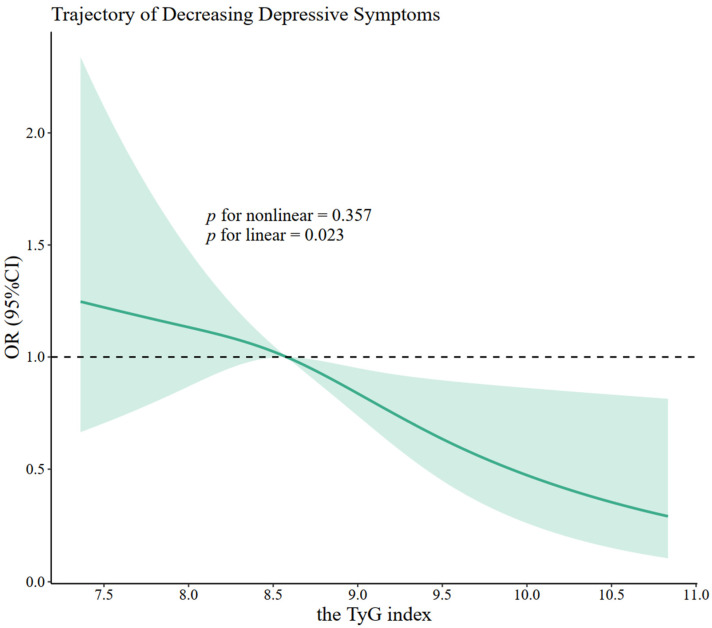
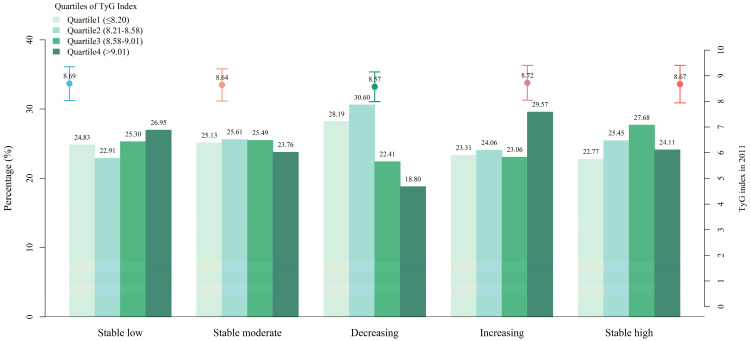
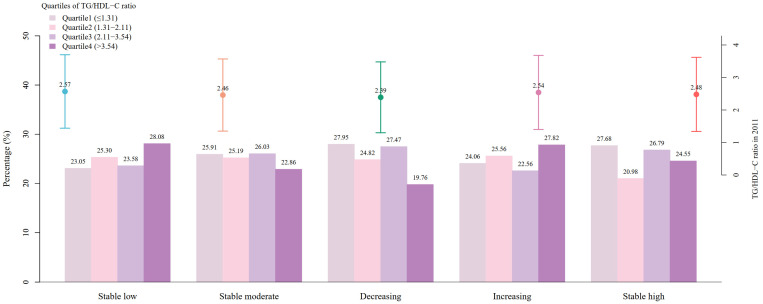
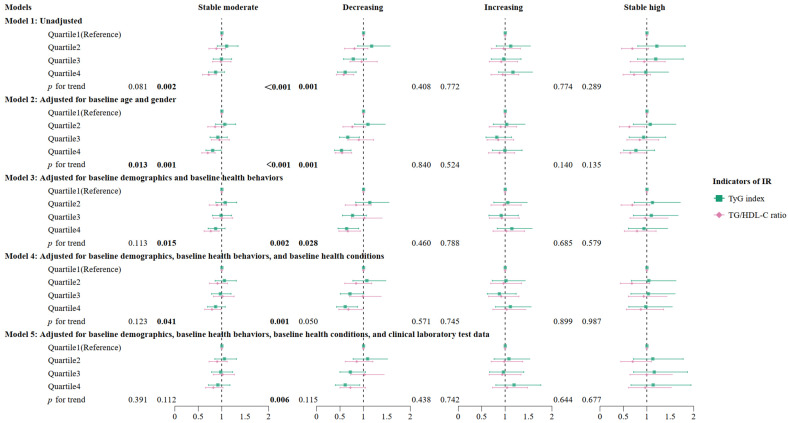
Five distinct trajectories of depressive symptoms characterized by stable low, stable moderate, decreasing, increasing, and stable high were identified during a follow-up of 7 years. The associations of the TyG index and the TG/HDL-C ratio with trajectories of depressive symptoms are not entirely consistent. After adjusting for covariates, a higher TyG index at baseline was associated with lower odds of being on the decreasing trajectory of depressive symptoms ( = 0.61, 95% CI: 0.40-0.92) compared to the stable low trajectory, and restricted cubic spline analysis revealed a negative linear relationship between the TyG index and the likelihood of a decreasing trajectory of depressive symptoms. However, the relationship between the TG/HDL-C ratio and the decreasing trajectory of depressive symptoms was no longer statistically significant when all confounders were controlled ( = 0.72, 95% CI: 0.50-1.04). Additionally, this negative association between the TyG index and decreasing trajectory of depressive symptoms was observed among 45-64-year-old individuals, female participants, those living in rural areas, and those with a normal BMI.
This study was conducted in a middle-aged and elderly population in China, and extrapolation to other regions and populations requires further confirmation.
Compared to the TG/HDL-C ratio, the TyG index may be a better predictor for trajectories of depressive symptoms in middle-aged and older adults. Considering that the pathology of depression progresses long term, our findings may have utility for identifying available and reliable markers for the development of depression.
探讨甘油三酯-葡萄糖(TyG)指数和甘油三酯与高密度脂蛋白胆固醇比值(TG/HDL-C)是否与抑郁症状轨迹相关。
在这项纵向研究中,从2011年至2018年的中国健康与养老追踪调查中招募了4215名45岁及以上的参与者。使用基于群组的轨迹模型确定由10项流行病学研究中心抑郁量表(CESD-10)测量的抑郁症状轨迹。采用多项逻辑模型和受限立方样条分析来研究TyG指数和TG/HDL-C比值与抑郁症状轨迹之间的关系。根据性别、年龄、居住地点和体重指数(BMI)进行分层分析。
在7年的随访期间,确定了五种不同的抑郁症状轨迹,其特征分别为稳定低水平、稳定中等水平、下降、上升和稳定高水平。TyG指数和TG/HDL-C比值与抑郁症状轨迹的关联并不完全一致。在调整协变量后,与稳定低水平轨迹相比,基线时较高的TyG指数与抑郁症状下降轨迹的较低几率相关(比值比 = 0.61,95%置信区间:0.40 - 0.92),并且受限立方样条分析显示TyG指数与抑郁症状下降轨迹的可能性之间存在负线性关系。然而,当控制所有混杂因素时,TG/HDL-C比值与抑郁症状下降轨迹之间的关系不再具有统计学意义(比值比 = 0.72,95%置信区间:0.50 - 1.04)。此外,在45 - 64岁个体、女性参与者、农村地区居民以及BMI正常的人群中观察到TyG指数与抑郁症状下降轨迹之间的这种负相关。
本研究在中国的中老年人群中进行,外推到其他地区和人群需要进一步证实。
与TG/HDL-C比值相比,TyG指数可能是中老年人群抑郁症状轨迹的更好预测指标。考虑到抑郁症的病理是长期发展的,我们的发现可能有助于识别抑郁症发展的可用且可靠的标志物。