Aber Rachael, Di Yanming, Dalziel Benjamin D
Department of Integrative Biology, Oregon State University, Corvallis, Oregon, United States of America.
Department of Statistics, Oregon State University, Corvallis, Oregon, United States of America.
PLoS Comput Biol. 2025 Jul 11;21(7):e1012882. doi: 10.1371/journal.pcbi.1012882. eCollection 2025 Jul.
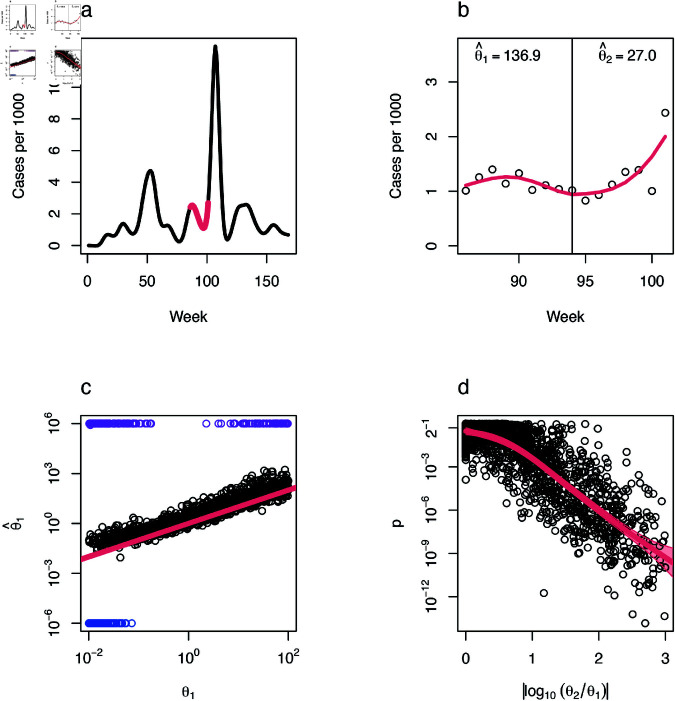
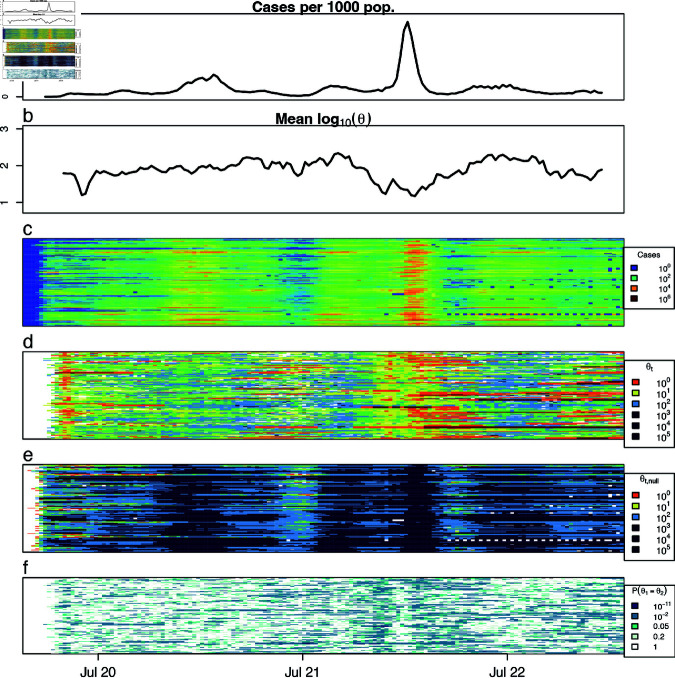
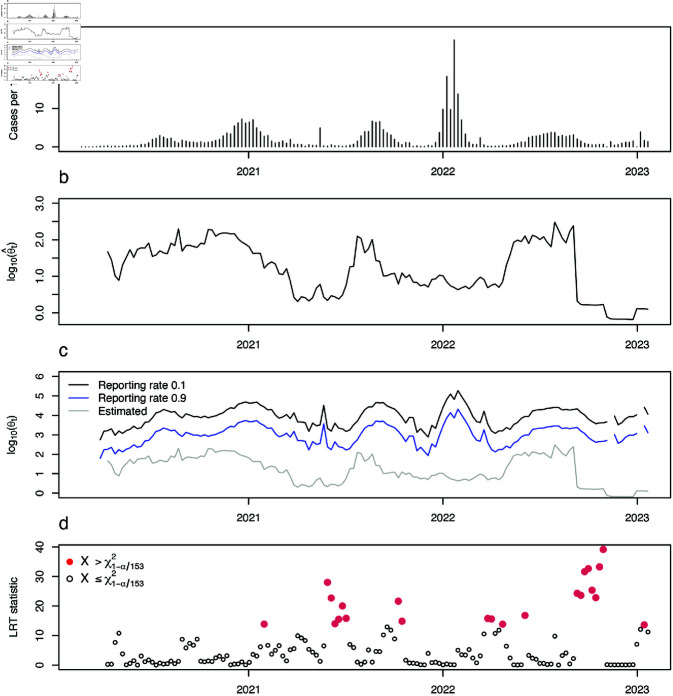
Trends in infectious disease incidence provide important information about epidemic dynamics and prospects for control. Higher-frequency variation around incidence trends can shed light on the processes driving epidemics in complex populations, as transmission heterogeneity, shifting landscapes of susceptibility, and fluctuations in reporting can impact the volatility of observed case counts. However, measures of temporal volatility in incidence, and how volatility changes over time, are often overlooked in population-level analyses of incidence data, which typically focus on moving averages. Here we present a statistical framework to quantify temporal changes in incidence dispersion and to detect rapid shifts in the dispersion parameter, which may signal new epidemic phases. We apply the method to COVID-19 incidence data in 144 United States (US) counties from January 1st, 2020 to March 23rd, 2023. Theory predicts that dispersion should be inversely proportional to incidence, however our method reveals pronounced temporal trends in dispersion that are not explained by incidence alone, but which are replicated across counties. In particular, dispersion increased around the major surge in cases in 2022, and highly overdispersed patterns became more frequent later in the time series. These increases potentially indicate transmission heterogeneity, changes in the susceptibility landscape, or that there were changes in reporting. Shifts in dispersion can also indicate shifts in epidemic phase, so our method provides a way for public health officials to anticipate and manage changes in epidemic regime and the drivers of transmission.
传染病发病率趋势为疫情动态和控制前景提供了重要信息。发病率趋势周围的高频变化可以揭示复杂人群中推动疫情的过程,因为传播异质性、易感性格局的变化以及报告的波动会影响观察到的病例数的波动性。然而,在发病率数据的人群水平分析中,发病率的时间波动性测量以及波动性如何随时间变化往往被忽视,这些分析通常侧重于移动平均值。在此,我们提出一个统计框架,以量化发病率离散度的时间变化,并检测离散度参数的快速变化,这可能预示着新的疫情阶段。我们将该方法应用于2020年1月1日至2023年3月23日美国144个县的新冠疫情发病率数据。理论预测离散度应与发病率成反比,然而我们的方法揭示了离散度明显的时间趋势,这并非仅由发病率所解释,而是在各县中都有体现。特别是,在2022年病例大幅激增期间离散度增加,并且在时间序列后期高度过度离散的模式变得更加频繁。这些增加可能表明传播异质性、易感性格局的变化,或者报告方面存在变化。离散度的变化也可能表明疫情阶段的转变,因此我们的方法为公共卫生官员提供了一种方式,来预测和管理疫情态势的变化以及传播驱动因素。