• 文献检索
  • 文档翻译
  • 深度研究
  • 学术资讯
  • Suppr Zotero 插件Zotero 插件
  • 邀请有礼
  • 套餐&价格
  • 历史记录
应用&插件
Suppr Zotero 插件Zotero 插件浏览器插件Mac 客户端Windows 客户端微信小程序
定价
高级版会员购买积分包购买API积分包
服务
文献检索文档翻译深度研究API 文档MCP 服务
关于我们
关于 Suppr公司介绍联系我们用户协议隐私条款
关注我们

Suppr 超能文献

核心技术专利:CN118964589B侵权必究
粤ICP备2023148730 号-1Suppr @ 2026

文献检索

告别复杂PubMed语法,用中文像聊天一样搜索,搜遍4000万医学文献。AI智能推荐,让科研检索更轻松。

立即免费搜索

文件翻译

保留排版,准确专业,支持PDF/Word/PPT等文件格式,支持 12+语言互译。

免费翻译文档

深度研究

AI帮你快速写综述,25分钟生成高质量综述,智能提取关键信息,辅助科研写作。

立即免费体验

马萨诸塞州中部的新冠病毒变异监测与社会决定因素:发展研究

COVID-19 Variant Surveillance and Social Determinants in Central Massachusetts: Development Study.

作者信息

Shi Qiming, Herbert Carly, Ward Doyle V, Simin Karl, McCormick Beth A, Ellison Iii Richard T, Zai Adrian H

机构信息

Center for Clinical and Translational Science, UMass Chan Medical School, Worcester, MA, United States.

Department of Population and Quantitative Health Sciences, UMass Chan Medical School, Worcester, MA, United States.

出版信息

JMIR Form Res. 2022 Jun 13;6(6):e37858. doi: 10.2196/37858.

DOI:10.2196/37858
PMID:35658093
原文链接:https://pmc.ncbi.nlm.nih.gov/articles/PMC9196873/
Abstract

BACKGROUND

Public health scientists have used spatial tools such as web-based Geographical Information System (GIS) applications to monitor and forecast the progression of the COVID-19 pandemic and track the impact of their interventions. The ability to track SARS-CoV-2 variants and incorporate the social determinants of health with street-level granularity can facilitate the identification of local outbreaks, highlight variant-specific geospatial epidemiology, and inform effective interventions. We developed a novel dashboard, the University of Massachusetts' Graphical user interface for Geographic Information (MAGGI) variant tracking system that combines GIS, health-associated sociodemographic data, and viral genomic data to visualize the spatiotemporal incidence of SARS-CoV-2 variants with street-level resolution while safeguarding protected health information. The specificity and richness of the dashboard enhance the local understanding of variant introductions and transmissions so that appropriate public health strategies can be devised and evaluated.

OBJECTIVE

We developed a web-based dashboard that simultaneously visualizes the geographic distribution of SARS-CoV-2 variants in Central Massachusetts, the social determinants of health, and vaccination data to support public health efforts to locally mitigate the impact of the COVID-19 pandemic.

METHODS

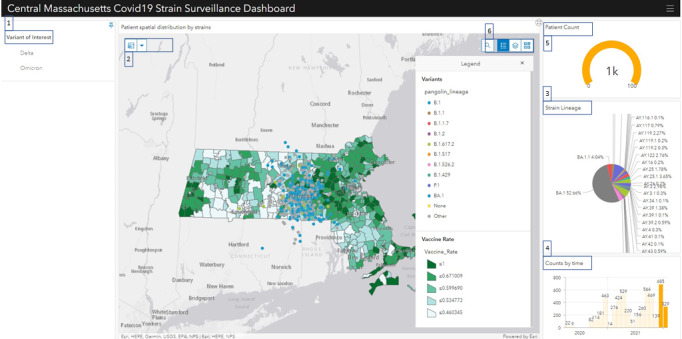
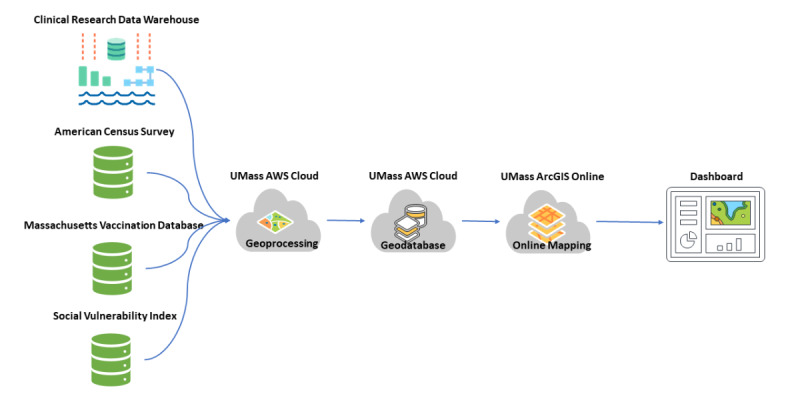
MAGGI uses a server-client model-based system, enabling users to access data and visualizations via an encrypted web browser, thus securing patient health information. We integrated data from electronic medical records, SARS-CoV-2 genomic analysis, and public health resources. We developed the following functionalities into MAGGI: spatial and temporal selection capability by zip codes of interest, the detection of variant clusters, and a tool to display variant distribution by the social determinants of health. MAGGI was built on the Environmental Systems Research Institute ecosystem and is readily adaptable to monitor other infectious diseases and their variants in real-time.

RESULTS

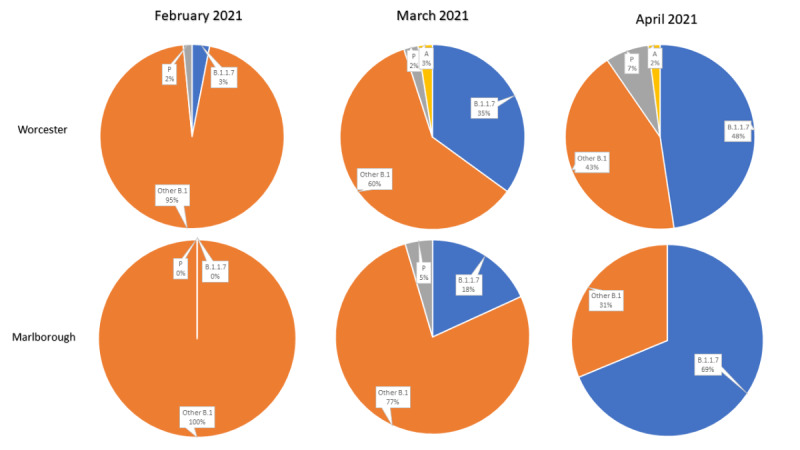
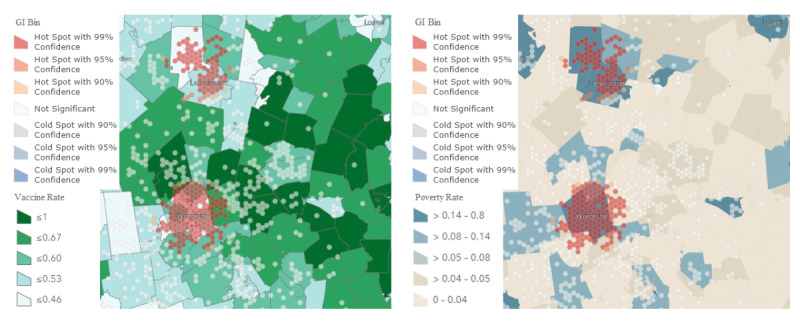
We created a geo-referenced database and added sociodemographic and viral genomic data to the ArcGIS dashboard that interactively displays Central Massachusetts' spatiotemporal variants distribution. Genomic epidemiologists and public health officials use MAGGI to show the occurrence of SARS-CoV-2 genomic variants at high geographic resolution and refine the display by selecting a combination of data features such as variant subtype, subject zip codes, or date of COVID-19-positive sample collection. Furthermore, they use it to scale time and space to visualize association patterns between socioeconomics, social vulnerability based on the Centers for Disease Control and Prevention's social vulnerability index, and vaccination rates. We launched the system at the University of Massachusetts Chan Medical School to support internal research projects starting in March 2021.

CONCLUSIONS

We developed a COVID-19 variant surveillance dashboard to advance our geospatial technologies to study SARS-CoV-2 variants transmission dynamics. This real-time, GIS-based tool exemplifies how spatial informatics can support public health officials, genomics epidemiologists, infectious disease specialists, and other researchers to track and study the spread patterns of SARS-CoV-2 variants in our communities.

摘要

背景

公共卫生科学家已使用基于网络的地理信息系统(GIS)应用程序等空间工具来监测和预测新冠疫情的发展,并追踪其干预措施的影响。能够追踪严重急性呼吸综合征冠状病毒2(SARS-CoV-2)变体并以街道级别的粒度纳入健康的社会决定因素,有助于识别局部疫情,突出特定变体的地理空间流行病学,并为有效的干预措施提供信息。我们开发了一个新颖的仪表板,即马萨诸塞大学地理信息图形用户界面(MAGGI)变体追踪系统,该系统结合了GIS、与健康相关的社会人口数据和病毒基因组数据,以街道级分辨率可视化SARS-CoV-2变体的时空发病率,同时保护受保护的健康信息。该仪表板的特异性和丰富性增强了对变体引入和传播的局部理解,从而可以制定和评估适当的公共卫生策略。

目的

我们开发了一个基于网络的仪表板,同时可视化马萨诸塞州中部SARS-CoV-2变体的地理分布、健康的社会决定因素和疫苗接种数据,以支持公共卫生工作,在当地减轻新冠疫情的影响。

方法

MAGGI使用基于服务器-客户端模型的系统,使用户能够通过加密的网络浏览器访问数据和可视化内容,从而确保患者健康信息的安全。我们整合了来自电子病历、SARS-CoV-2基因组分析和公共卫生资源的数据。我们在MAGGI中开发了以下功能:按感兴趣的邮政编码进行空间和时间选择功能、变体集群检测功能,以及一个按健康的社会决定因素显示变体分布的工具。MAGGI建立在环境系统研究所的生态系统之上,很容易适应实时监测其他传染病及其变体。

结果

我们创建了一个地理参考数据库,并将社会人口和病毒基因组数据添加到ArcGIS仪表板中,该仪表板交互式显示马萨诸塞州中部的时空变体分布。基因组流行病学家和公共卫生官员使用MAGGI以高地理分辨率展示SARS-CoV-2基因组变体的发生情况,并通过选择数据特征的组合(如变体亚型、受试者邮政编码或新冠病毒检测呈阳性样本的采集日期)来优化显示。此外,他们使用它来缩放时间和空间,以可视化社会经济、基于疾病控制和预防中心社会脆弱性指数的社会脆弱性与疫苗接种率之间的关联模式。我们于2021年3月在马萨诸塞大学医学院启动了该系统,以支持内部研究项目。

结论

我们开发了一个新冠病毒变体监测仪表板,以推进我们的地理空间技术,研究SARS-CoV-2变体的传播动态。这个基于GIS的实时工具例证了空间信息学如何支持公共卫生官员、基因组流行病学家、传染病专家和其他研究人员追踪和研究SARS-CoV-2变体在我们社区中的传播模式。

https://cdn.ncbi.nlm.nih.gov/pmc/blobs/d38f/9196873/12373c26192b/formative_v6i6e37858_fig4.jpg
https://cdn.ncbi.nlm.nih.gov/pmc/blobs/d38f/9196873/2044e52b16f5/formative_v6i6e37858_fig1.jpg
https://cdn.ncbi.nlm.nih.gov/pmc/blobs/d38f/9196873/3891bee17314/formative_v6i6e37858_fig2.jpg
https://cdn.ncbi.nlm.nih.gov/pmc/blobs/d38f/9196873/08f59a4efd29/formative_v6i6e37858_fig3.jpg
https://cdn.ncbi.nlm.nih.gov/pmc/blobs/d38f/9196873/12373c26192b/formative_v6i6e37858_fig4.jpg

相似文献

1
COVID-19 Variant Surveillance and Social Determinants in Central Massachusetts: Development Study.马萨诸塞州中部的新冠病毒变异监测与社会决定因素:发展研究
JMIR Form Res. 2022 Jun 13;6(6):e37858. doi: 10.2196/37858.
2
Taxonium, a web-based tool for exploring large phylogenetic trees.Taxonium,一个用于探索大型系统发育树的网络工具。
Elife. 2022 Nov 15;11:e82392. doi: 10.7554/eLife.82392.
3
Interactive SARS-CoV-2 dashboard for real-time geospatial visualisation of sewage and clinical surveillance data from Dhaka, Bangladesh: a tool for public health situational awareness.交互式 SARS-CoV-2 数据面板,用于实时地理空间可视化来自孟加拉国达卡的污水和临床监测数据:公共卫生态势感知工具。
BMJ Glob Health. 2023 Aug;8(8). doi: 10.1136/bmjgh-2023-012921.
4
Easier surveillance of climate-related health vulnerabilities through a Web-based spatial OLAP application.通过基于网络的空间联机分析处理应用程序,更轻松地监测与气候相关的健康脆弱性。
Int J Health Geogr. 2009 Apr 3;8:18. doi: 10.1186/1476-072X-8-18.
5
Detection of Spatiotemporal Clusters of COVID-19-Associated Symptoms and Prevention Using a Participatory Surveillance App: Protocol for the @choum Study.使用参与式监测应用程序检测新冠病毒相关症状的时空聚集情况及预防措施:@choum研究方案
JMIR Res Protoc. 2021 Oct 6;10(10):e30444. doi: 10.2196/30444.
6
K-Track-Covid: interactive web-based dashboard for analyzing geographical and temporal spread of COVID-19 in South Korea.K-Track-Covid:用于分析韩国 COVID-19 地理和时间传播的交互式网络仪表板。
Front Public Health. 2024 Apr 26;12:1347862. doi: 10.3389/fpubh.2024.1347862. eCollection 2024.
7
Estimation and worldwide monitoring of the effective reproductive number of SARS-CoV-2.估算和全球监测 SARS-CoV-2 的有效繁殖数。
Elife. 2022 Aug 8;11:e71345. doi: 10.7554/eLife.71345.
8
Application of Phylodynamic Tools to Inform the Public Health Response to COVID-19: Qualitative Analysis of Expert Opinions.应用系统发育动力学工具为新冠疫情的公共卫生应对提供信息:专家意见的定性分析
JMIR Form Res. 2023 Apr 21;7:e39409. doi: 10.2196/39409.
9
Built by epidemiologists for epidemiologists: an internal COVID-19 dashboard for real-time situational awareness in New York City.由流行病学家为流行病学家打造:纽约市用于实时态势感知的新冠肺炎内部仪表盘。
JAMIA Open. 2022 May 18;5(2):ooac029. doi: 10.1093/jamiaopen/ooac029. eCollection 2022 Jul.
10
Early detection of SARS-CoV-2 variants through dynamic co-mutation network surveillance.通过动态共突变网络监测早期发现 SARS-CoV-2 变体。
Front Public Health. 2023 Jan 23;11:1015969. doi: 10.3389/fpubh.2023.1015969. eCollection 2023.

引用本文的文献

1
Design, Application, and Actionability of US Public Health Data Dashboards: Scoping Review.美国公共卫生数据仪表盘的设计、应用与可操作性:范围综述
J Med Internet Res. 2025 May 21;27:e65283. doi: 10.2196/65283.
2
Genomic and spatial epidemiology: lessons learned from SARS-CoV-2 pandemic.基因组与空间流行病学:从新冠疫情中汲取的经验教训
Curr Opin HIV AIDS. 2025 May 1;20(3):287-293. doi: 10.1097/COH.0000000000000936. Epub 2025 Apr 1.
3
Realizing the potential of social determinants data in EHR systems: A scoping review of approaches for screening, linkage, extraction, analysis, and interventions.

本文引用的文献

1
A New Way to Trace SARS-CoV-2 Variants Through Weighted Network Analysis of Frequency Trajectories of Mutations.通过对突变频率轨迹进行加权网络分析来追踪新冠病毒变异株的新方法。
Front Microbiol. 2022 Mar 16;13:859241. doi: 10.3389/fmicb.2022.859241. eCollection 2022.
2
Spatiotemporal Analysis for COVID-19 Delta Variant Using GIS-Based Air Parameter and Spatial Modeling.基于 GIS 的空气参数和空间建模的 COVID-19 德尔塔变异的时空分析。
Int J Environ Res Public Health. 2022 Jan 30;19(3):1614. doi: 10.3390/ijerph19031614.
3
Data-driven analysis of amino acid change dynamics timely reveals SARS-CoV-2 variant emergence.
认识电子健康记录系统中社会决定因素数据的潜力:对筛查、关联、提取、分析和干预方法的范围审查
J Clin Transl Sci. 2024 Oct 10;8(1):e147. doi: 10.1017/cts.2024.571. eCollection 2024.
4
Factors associated with non-adherence to dual-energy x-ray absorptiometry screening during the COVID-19 pandemic in an academic medical center.在学术医疗中心 COVID-19 大流行期间,与双能 X 射线吸收法筛检不依从相关的因素。
Arch Osteoporos. 2024 Jul 30;19(1):66. doi: 10.1007/s11657-024-01430-2.
5
Unseen Risk: Mapping Contamination Hazards to Enhance Risk Perception in Galena Park, Texas.无形风险:绘制污染危害以增强德克萨斯州加莱纳公园的风险认知
Clim Risk Manag. 2023;41. doi: 10.1016/j.crm.2023.100532. Epub 2023 Jun 15.
6
An Old Acquaintance: Could Adenoviruses Be Our Next Pandemic Threat?旧相识:腺病毒会成为下一个大流行威胁吗?
Viruses. 2023 Jan 24;15(2):330. doi: 10.3390/v15020330.
基于数据的氨基酸变化动力学分析及时揭示了 SARS-CoV-2 变体的出现。
Sci Rep. 2021 Oct 26;11(1):21068. doi: 10.1038/s41598-021-00496-z.
4
Real-time geospatial analysis identifies gaps in COVID-19 vaccination in a minority population.实时地理空间分析揭示了少数族裔人群在新冠疫苗接种方面存在的差距。
Sci Rep. 2021 Sep 13;11(1):18117. doi: 10.1038/s41598-021-97416-y.
5
A review of GIS methodologies to analyze the dynamics of COVID-19 in the second half of 2020.2020年下半年用于分析新冠疫情动态的地理信息系统方法综述。
Trans GIS. 2021 Oct;25(5):2191-2239. doi: 10.1111/tgis.12792. Epub 2021 Jul 11.
6
Building an Interactive Geospatial Visualization Application for National Health Care-Associated Infection Surveillance: Development Study.构建用于国家医疗保健相关感染监测的交互式地理空间可视化应用程序:开发研究
JMIR Public Health Surveill. 2021 Jul 30;7(7):e23528. doi: 10.2196/23528.
7
Social Determinants of Health and Care Outcomes Among People With HIV in the United States.美国艾滋病毒感染者健康和护理结果的社会决定因素
Open Forum Infect Dis. 2021 Jun 22;8(7):ofab330. doi: 10.1093/ofid/ofab330. eCollection 2021 Jul.
8
Comparative Genomics Reveals Early Emergence and Biased Spatiotemporal Distribution of SARS-CoV-2.比较基因组学揭示了 SARS-CoV-2 的早期出现和偏时空分布。
Mol Biol Evol. 2021 May 19;38(6):2547-2565. doi: 10.1093/molbev/msab049.
9
Phylogenetic analysis of SARS-CoV-2 in Boston highlights the impact of superspreading events.波士顿地区 SARS-CoV-2 的系统进化分析强调了超级传播事件的影响。
Science. 2021 Feb 5;371(6529). doi: 10.1126/science.abe3261. Epub 2020 Dec 10.
10
Genomic epidemiology of superspreading events in Austria reveals mutational dynamics and transmission properties of SARS-CoV-2.奥地利超级传播事件的基因组流行病学揭示了 SARS-CoV-2 的突变动态和传播特性。
Sci Transl Med. 2020 Dec 9;12(573). doi: 10.1126/scitranslmed.abe2555. Epub 2020 Nov 23.