Joachimiak Marcin P, Weisman Jennifer L, May Barnaby Ch
Department of Plant and Microbial Biology, 461 Koshland Hall, University of California Berkeley, CA 94720-3102, USA.
BMC Bioinformatics. 2006 Apr 27;7:225. doi: 10.1186/1471-2105-7-225.
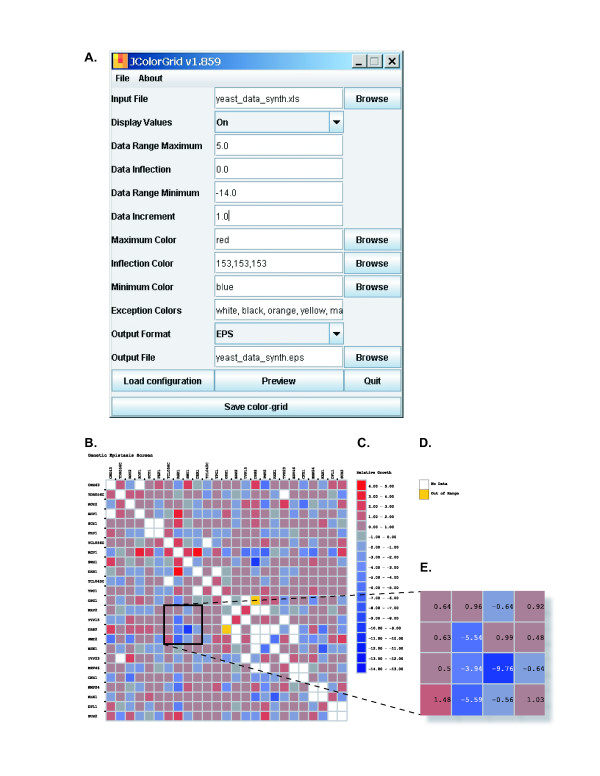
Two-dimensional data colourings are an effective medium by which to represent three-dimensional data in two dimensions. Such "color-grid" representations have found increasing use in the biological sciences (e.g. microarray 'heat maps' and bioactivity data) as they are particularly suited to complex data sets and offer an alternative to the graphical representations included in traditional statistical software packages. The effectiveness of color-grids lies in their graphical design, which introduces a standard for customizable data representation. Currently, software applications capable of generating limited color-grid representations can be found only in advanced statistical packages or custom programs (e.g. micro-array analysis tools), often associated with steep learning curves and requiring expert knowledge.
Here we describe JColorGrid, a Java library and platform independent application that renders color-grid graphics from data. The software can be used as a Java library, as a command-line application, and as a color-grid parameter interface and graphical viewer application. Data, titles, and data labels are input as tab-delimited text files or Microsoft Excel spreadsheets and the color-grid settings are specified through the graphical interface or a text configuration file. JColorGrid allows both user graphical data exploration as well as a means of automatically rendering color-grids from data as part of research pipelines.
The program has been tested on Windows, Mac, and Linux operating systems, and the binary executables and source files are available for download at http://jcolorgrid.ucsf.edu.
二维数据着色是在二维空间中表示三维数据的一种有效媒介。这种“颜色网格”表示法在生物科学领域(如微阵列“热图”和生物活性数据)的应用越来越广泛,因为它们特别适合复杂数据集,并且为传统统计软件包中的图形表示提供了一种替代方案。颜色网格的有效性在于其图形设计,它引入了一种可定制数据表示的标准。目前,能够生成有限颜色网格表示的软件应用程序仅存在于高级统计软件包或定制程序(如微阵列分析工具)中,这些软件通常伴随着陡峭的学习曲线,并且需要专业知识。
在此,我们描述了JColorGrid,一个用于从数据渲染颜色网格图形的Java库和独立于平台的应用程序。该软件既可以用作Java库,也可以用作命令行应用程序,还可以用作颜色网格参数接口和图形查看器应用程序。数据、标题和数据标签作为以制表符分隔的文本文件或Microsoft Excel电子表格输入,颜色网格设置通过图形界面或文本配置文件指定。JColorGrid既允许用户进行图形化数据探索,也提供了一种作为研究流程一部分从数据自动渲染颜色网格的方法。
该程序已在Windows、Mac和Linux操作系统上进行了测试,其二进制可执行文件和源文件可在http://jcolorgrid.ucsf.edu下载。