Applegate Raymond A, Marsack Jason D, Thibos Larry N
Visual Optics Institute, College of Optometry, University of Houston, Houston, Texas 77204-2020, USA.
Optom Vis Sci. 2006 Sep;83(9):635-40. doi: 10.1097/01.opx.0000232842.60932.af.
The purpose of this study is to determine the ability of single-value metrics of retinal image quality of the eye to predict visual performance as measured by high (HC) and low (LC) -contrast acuity at photopic (P) and mesopic (M) light levels in eyes with 20/17 and better visual acuity.
Forty-nine normal subjects in good health ranging in age from 21.8 to 62.6 with 20/17 or better monocular high-contrast logarithm of the minimum angle of resolution (logMAR) acuity served as subjects. Wavefront error through the 10th Zernike radial order over a 7-mm pupil was measured on each test eye using a custom-built Shack/Hartmann wavefront sensor. For each eye, 31 different single-value retinal image quality metrics were calculated. Visual acuity was measured using HC (95%) and LC (11%) logMAR at photopic (270 cd/m) and mesopic (0.75 cd/m) light levels. To determine the ability of each metric of retinal image quality to predict each type of logMAR acuity (P HC, P LC, M HC, and M LC), each acuity measure was regressed against each optical quality metric.
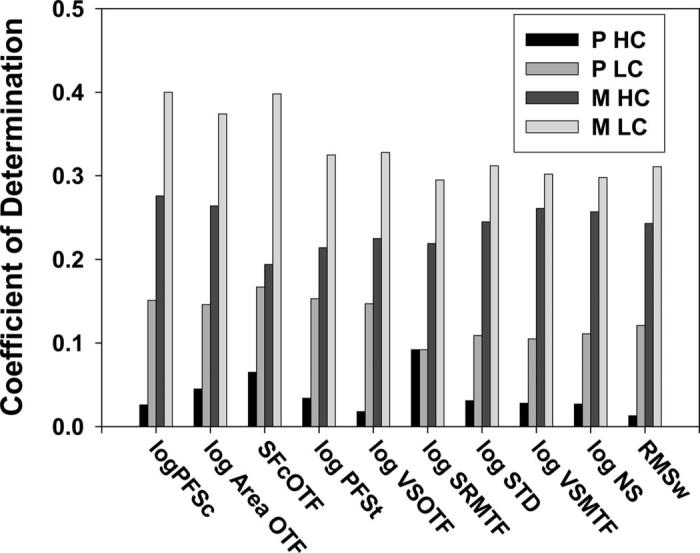
The ability of the metrics of retinal image quality to predict logMAR acuity improved as luminance and/or contrast is lowered. The best retinal image quality metric (logPFSc) accounted for 2.6%, 15.1%, 27.6%, and 40.0% of the variance in P HC, P LC, M HC, and M LC logMAR acuity, respectively.
In eyes with 20/17 and better P HC acuity, P HC logMAR acuity is insensitive to variations in retinal image quality compared with M LC logMAR acuity. Retinal image quality becomes increasingly predictive of logMAR acuity as contrast and/or luminance is decreased. Everyday life requires individuals to function over a large range of contrast and luminance levels. Clinically, the impact of retinal image quality as a function of luminance and contrast is readily measurable in a time-efficient manner with M LC logMAR acuity charts.
本研究旨在确定眼睛视网膜图像质量的单值指标预测视觉性能的能力,该视觉性能通过20/17及以上视力的眼睛在明视(P)和中间视觉(M)光照水平下的高对比度(HC)和低对比度(LC)视力来衡量。
49名年龄在21.8至62.6岁之间、单眼高对比度最小分辨角对数(logMAR)视力为20/17或更好的健康正常受试者作为研究对象。使用定制的Shack/Hartmann波前传感器在每只测试眼睛上测量7毫米瞳孔范围内第10阶泽尼克径向阶数的波前误差。对于每只眼睛,计算31种不同的单值视网膜图像质量指标。在明视(270 cd/m²)和中间视觉(0.75 cd/m²)光照水平下,使用HC(95%)和LC(11%)logMAR测量视力。为了确定每个视网膜图像质量指标预测每种类型logMAR视力(P HC、P LC、M HC和M LC)的能力,将每个视力测量值与每个光学质量指标进行回归分析。
随着亮度和/或对比度降低,视网膜图像质量指标预测logMAR视力的能力提高。最佳视网膜图像质量指标(logPFSc)分别占P HC、P LC、M HC和M LC logMAR视力方差的2.6%、15.1%、27.6%和40.0%。
在20/17及以上P HC视力的眼睛中,与M LC logMAR视力相比,P HC logMAR视力对视网膜图像质量的变化不敏感。随着对比度和/或亮度降低,视网膜图像质量对logMAR视力的预测性越来越高。日常生活中,个体需要在大范围的对比度和亮度水平下发挥功能。临床上,使用M LC logMAR视力表可以高效地测量视网膜图像质量随亮度和对比度变化的影响。