Weinstein James N, Lurie Jon D, Olson Patrick R, Bronner Kristen K, Fisher Elliott S
Department of Orthopaedics, Dartmouth Medical School, Hanover, NH 03756, USA.
Spine (Phila Pa 1976). 2006 Nov 1;31(23):2707-14. doi: 10.1097/01.brs.0000248132.15231.fe.
Repeated cross-sectional analysis using national Medicare data from the Dartmouth Atlas Project.
To describe recent trends and geographic variation in population-based rates of lumbar fusion spine surgery.
Lumbar fusion rates have increased dramatically during the 1980s and even more so in the 1990s. The most rapid increase appeared to follow the approval of a new surgical implant device.
Medicare claims and enrollment data were used to calculate age, sex, and race-adjusted rates of lumbar laminectomy/discectomy and lumbar fusion for fee-for-service Medicare beneficiaries over age 65 in each of the 306 US Hospital Referral Regions between 1992 and 2003.
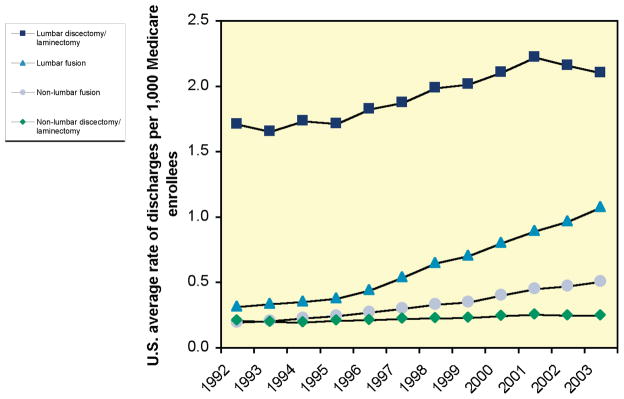
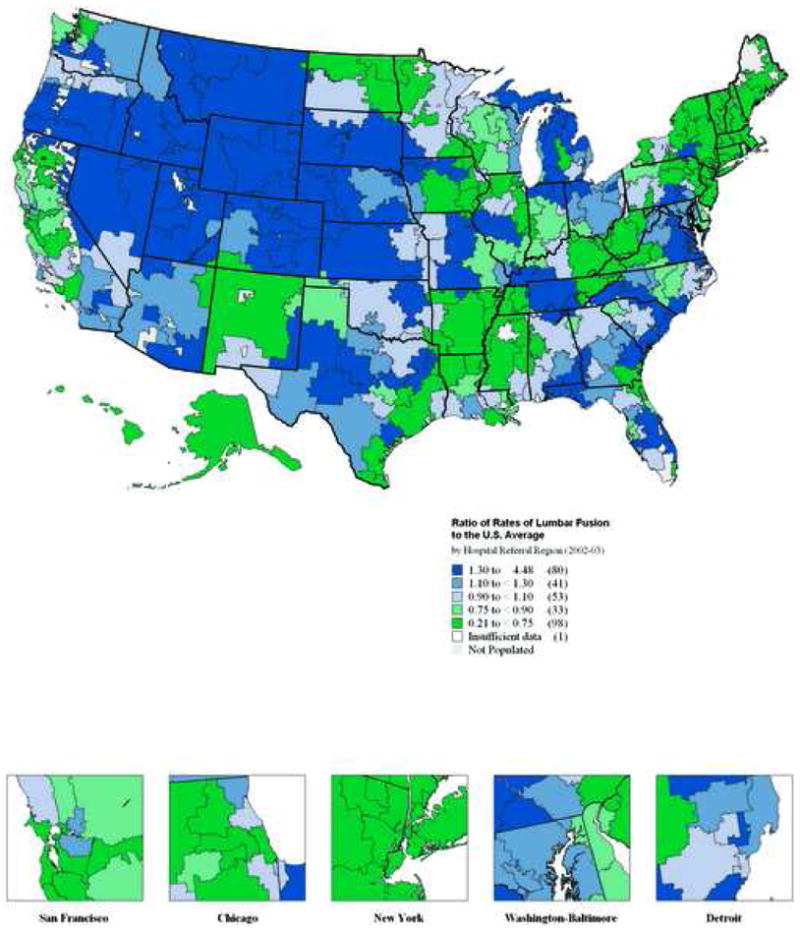
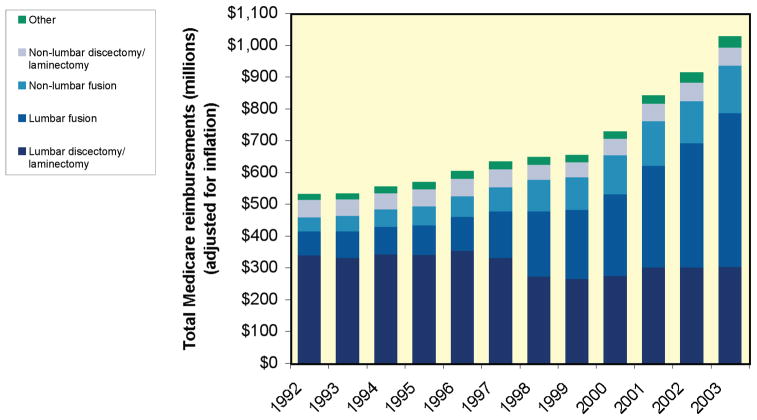
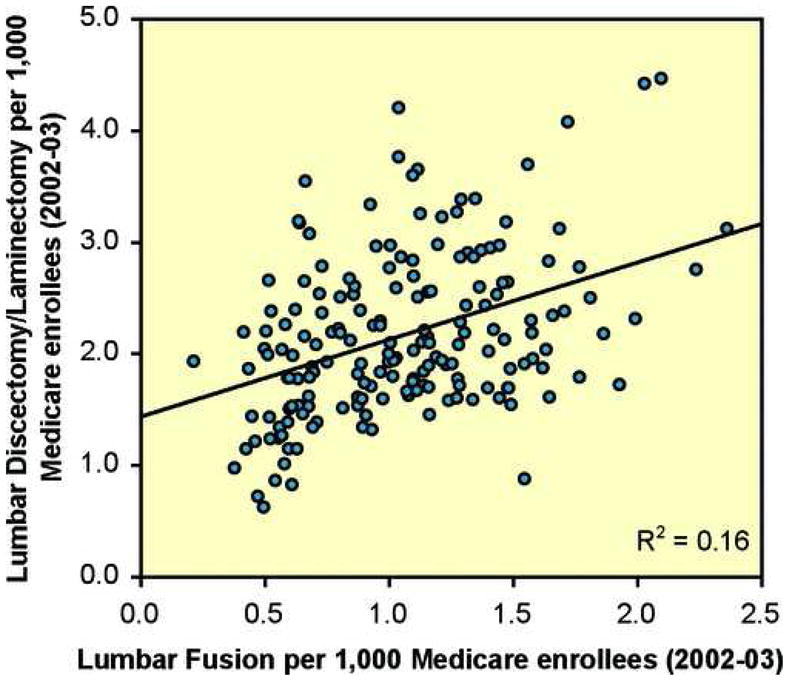
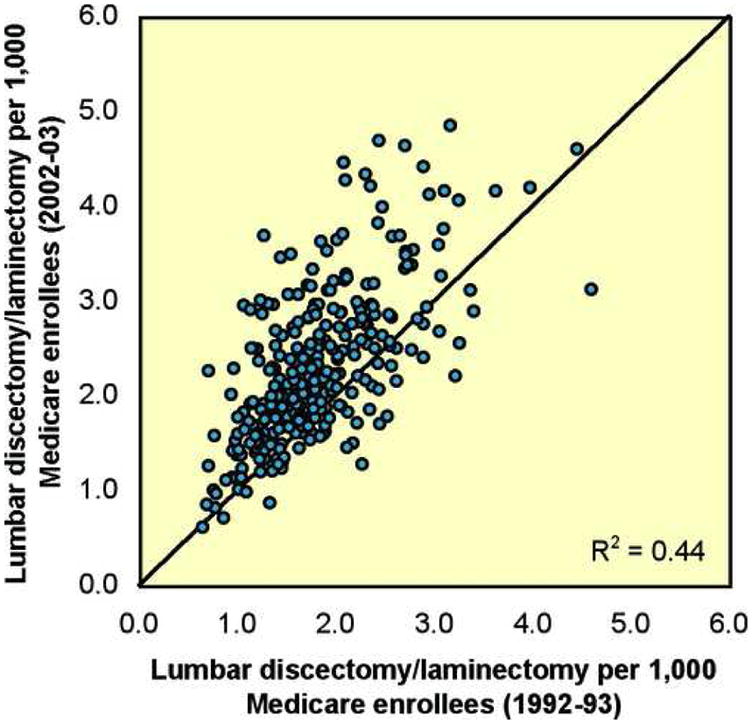
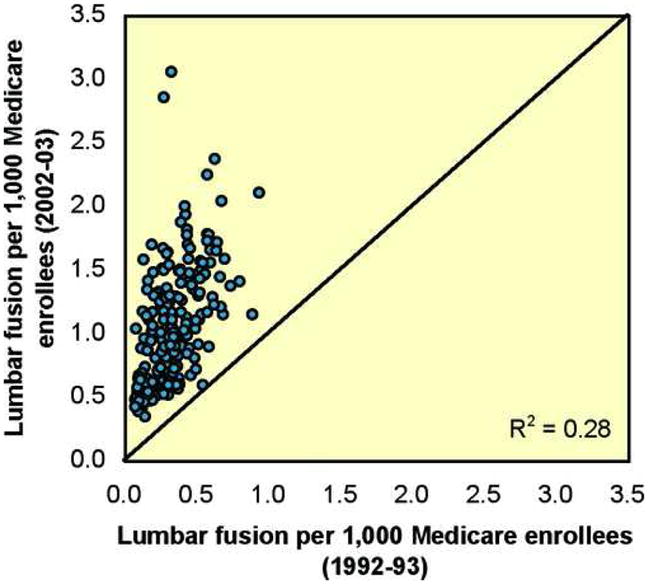
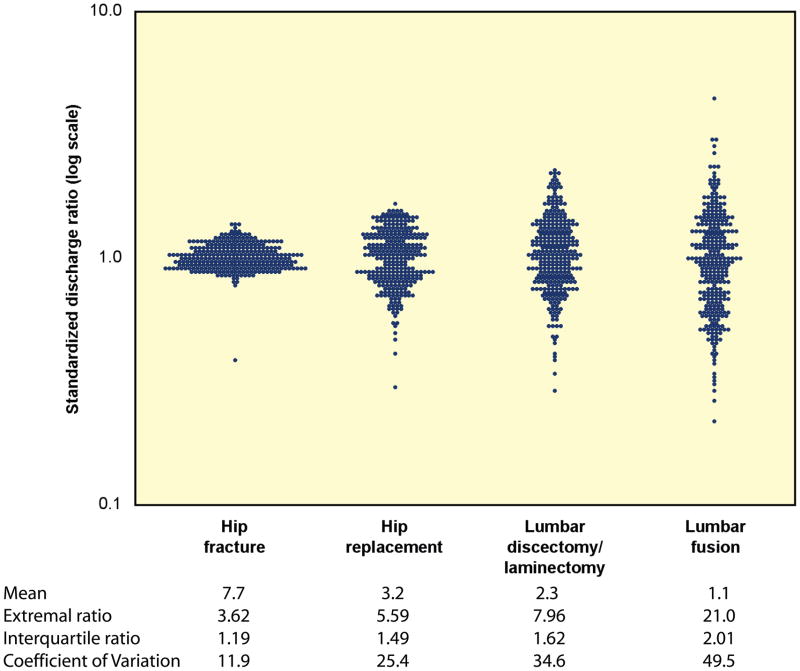
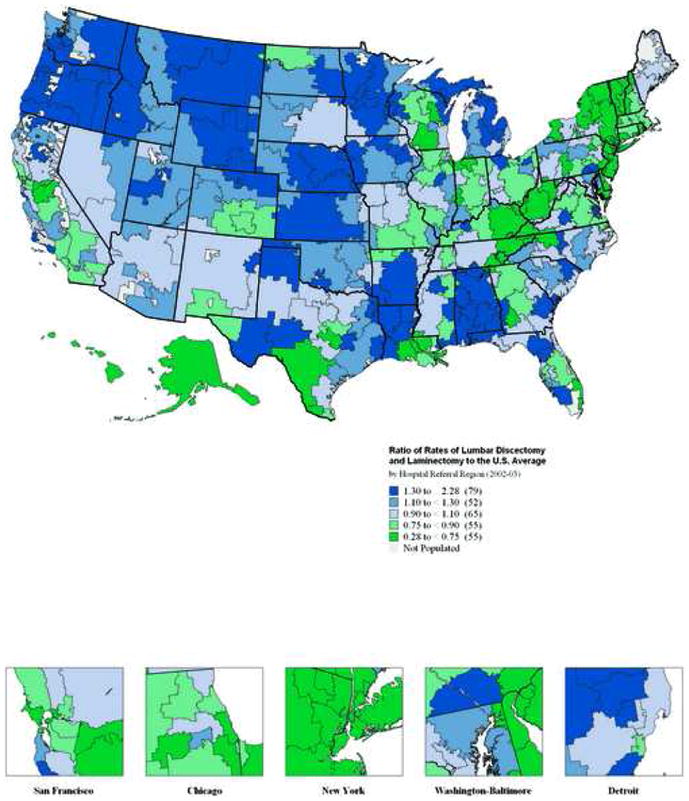
Lumbar fusion rates have increased steadily since 1992 (0.3 per 1000 enrollees in 1992 to 1.1 per 1000 enrollees in 2003). Regional rates of lumbar discectomy, laminectomy, and fusion in 1992-1993 were highly correlated to rates of discectomy, laminectomy (R2 = 0.44), and fusion (R2 = 0.28) in 2002-2003. There was a nearly 8-fold variation in regional rates of lumbar discectomy and laminectomy in 2002 and 2003. In the case of lumbar fusion, there was nearly a 20-fold range in rates among Medicare enrollees in 2002 and 2003. This represents the largest coefficient of variation seen with any surgical procedure. Medicare spending for inpatient back surgery more than doubled over the decade. Spending for lumbar fusion increased more than 500%, from 75 million dollars to 482 million dollars. In 1992, lumbar fusion represented 14% of total spending for back surgery; by 2003, lumbar fusion accounted for 47% of spending.
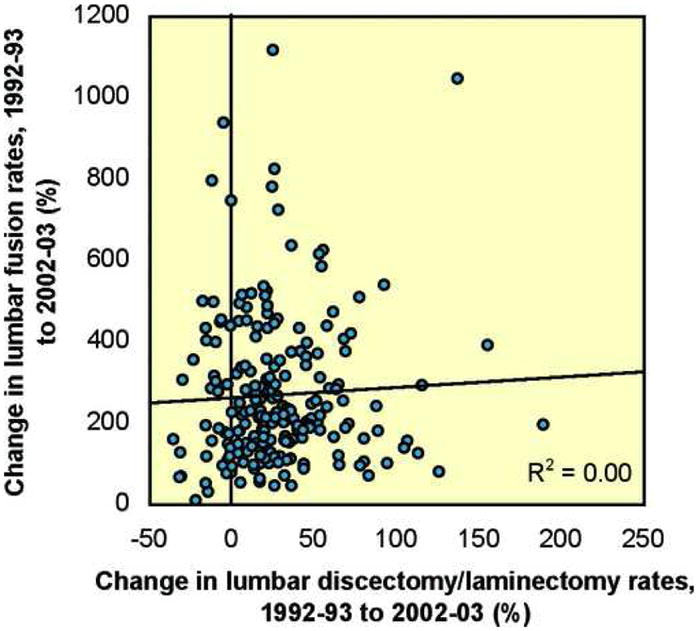
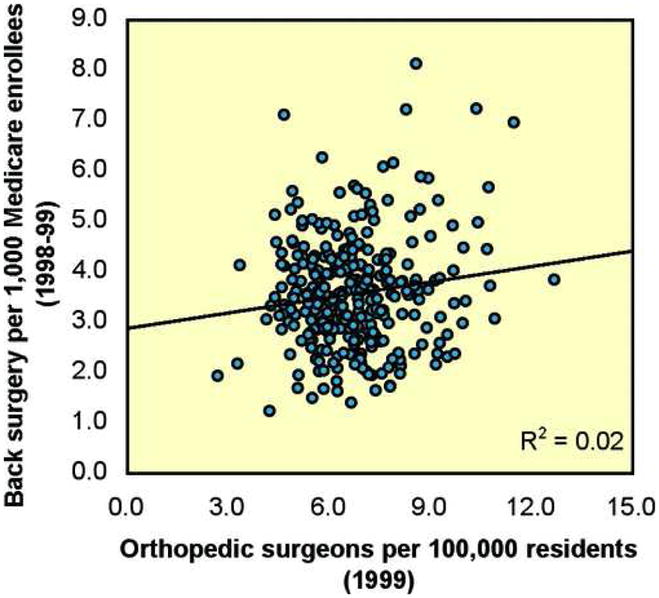
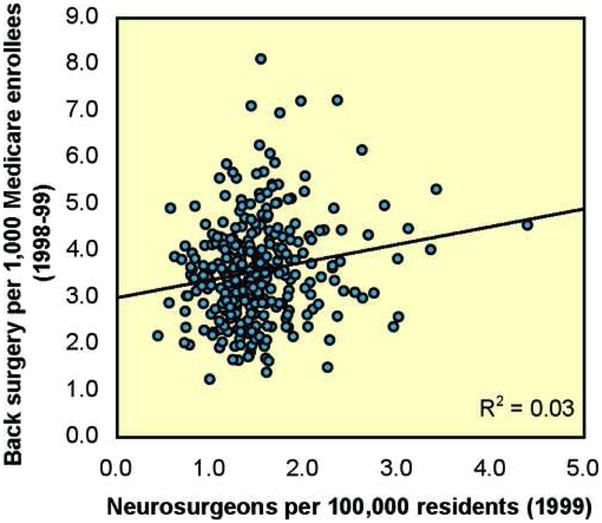
The rate of specific procedures within a region or "surgical signature" is remarkably stable over time. However, there has been a marked increase in rates of fusion, and a coincident shift and increase in cost. Rates of back surgery were not correlated with the per-capita supply of orthopedic and neurosurgeons.
使用来自达特茅斯地图集项目的全国医疗保险数据进行重复横断面分析。
描述基于人群的腰椎融合脊柱手术发生率的近期趋势和地理差异。
腰椎融合率在20世纪80年代急剧上升,在90年代更是如此。增长最为迅速的时期似乎是在一种新型手术植入装置获批之后。
利用医疗保险理赔和参保数据,计算1992年至2003年间美国306个医院转诊区域中,65岁以上按服务收费的医疗保险受益人的年龄、性别和种族调整后的腰椎椎板切除术/椎间盘切除术和腰椎融合率。
自1992年以来,腰椎融合率稳步上升(从1992年每1000名参保人中0.3例增至2003年每1000名参保人中1.1例)。1992 - 1993年各区域的腰椎间盘切除术、椎板切除术和融合率与2002 - 2003年的椎间盘切除术、椎板切除术(R² = 0.44)和融合率(R² = 0.28)高度相关。2002年和2003年各区域的腰椎间盘切除术和椎板切除术发生率相差近8倍。就腰椎融合而言,2002年和2003年医疗保险参保人的发生率范围近20倍。这是所有外科手术中变异系数最大的。十年间,医疗保险用于住院背部手术的支出增加了一倍多。腰椎融合的支出增加了500%以上,从7500万美元增至4.82亿美元。1992年,腰椎融合占背部手术总支出的14%;到2003年,腰椎融合占支出的47%。
一个地区内特定手术的发生率或“手术特征”随时间相当稳定。然而,融合率显著上升,同时成本发生了相应的变化和增加。背部手术发生率与骨科和神经外科医生的人均供应量无关。