• 文献检索
  • 文档翻译
  • 深度研究
  • 学术资讯
  • Suppr Zotero 插件Zotero 插件
  • 邀请有礼
  • 套餐&价格
  • 历史记录
应用&插件
Suppr Zotero 插件Zotero 插件浏览器插件Mac 客户端Windows 客户端微信小程序
定价
高级版会员购买积分包购买API积分包
服务
文献检索文档翻译深度研究API 文档MCP 服务
关于我们
关于 Suppr公司介绍联系我们用户协议隐私条款
关注我们

Suppr 超能文献

核心技术专利:CN118964589B侵权必究
粤ICP备2023148730 号-1Suppr @ 2026

文献检索

告别复杂PubMed语法,用中文像聊天一样搜索,搜遍4000万医学文献。AI智能推荐,让科研检索更轻松。

立即免费搜索

文件翻译

保留排版,准确专业,支持PDF/Word/PPT等文件格式,支持 12+语言互译。

免费翻译文档

深度研究

AI帮你快速写综述,25分钟生成高质量综述,智能提取关键信息,辅助科研写作。

立即免费体验

低信号微阵列研究中的分层偏差。

Stratification bias in low signal microarray studies.

作者信息

Parker Brian J, Günter Simon, Bedo Justin

机构信息

Statistical Machine Learning Group, NICTA, Canberra, Australia.

出版信息

BMC Bioinformatics. 2007 Sep 2;8:326. doi: 10.1186/1471-2105-8-326.

DOI:10.1186/1471-2105-8-326
PMID:17764577
原文链接:https://pmc.ncbi.nlm.nih.gov/articles/PMC2211509/
Abstract

BACKGROUND

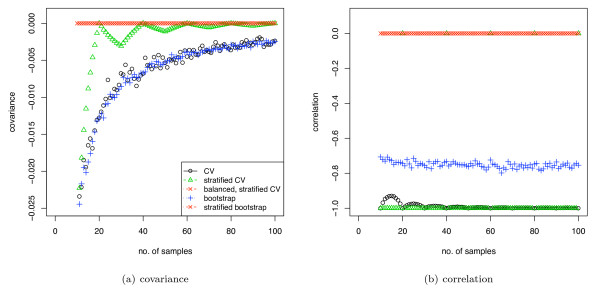
When analysing microarray and other small sample size biological datasets, care is needed to avoid various biases. We analyse a form of bias, stratification bias, that can substantially affect analyses using sample-reuse validation techniques and lead to inaccurate results. This bias is due to imperfect stratification of samples in the training and test sets and the dependency between these stratification errors, i.e. the variations in class proportions in the training and test sets are negatively correlated.

RESULTS

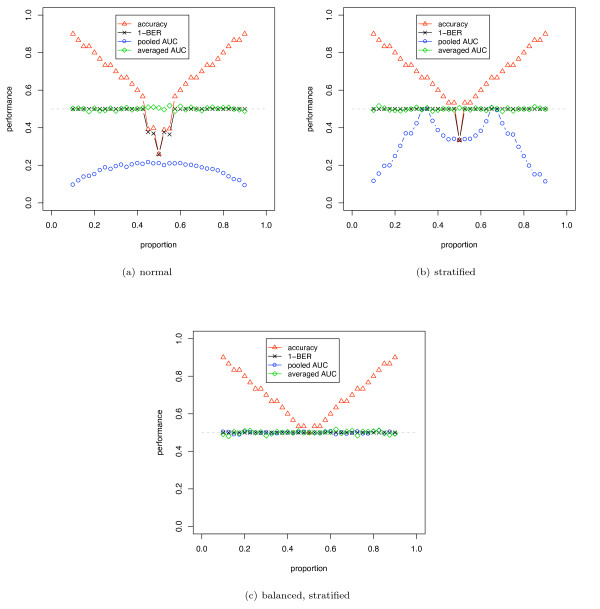
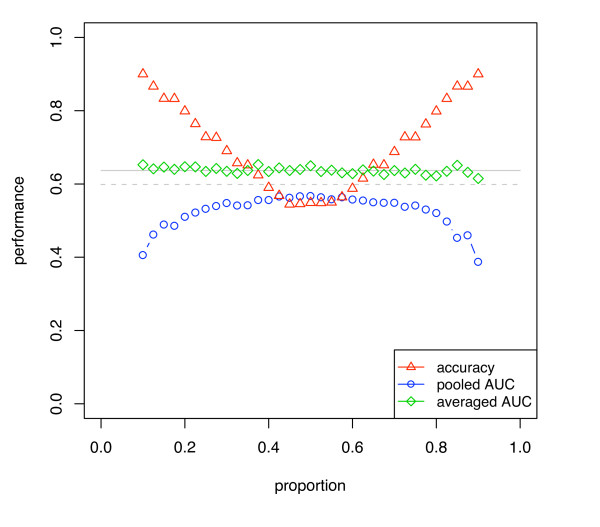
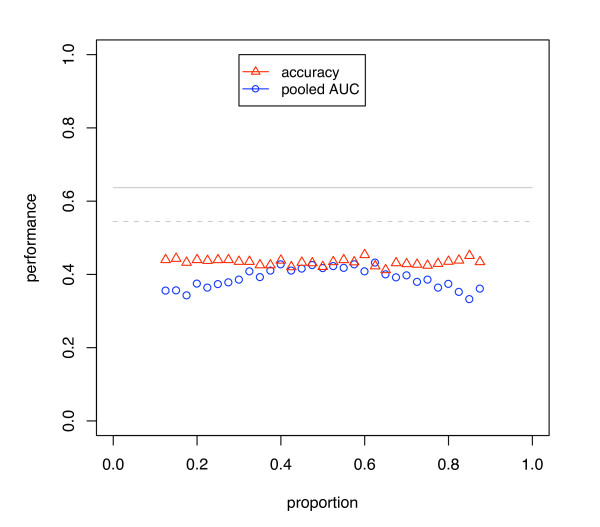
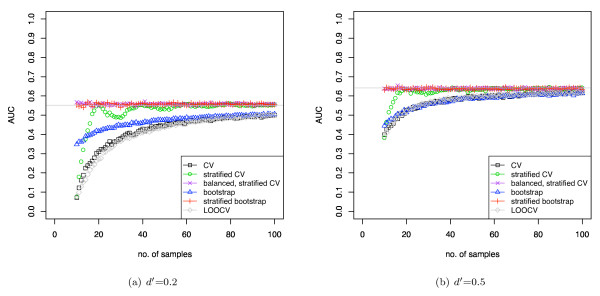
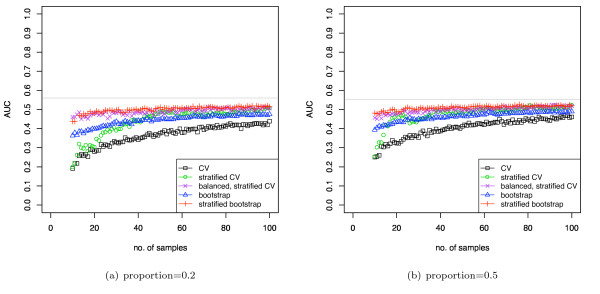
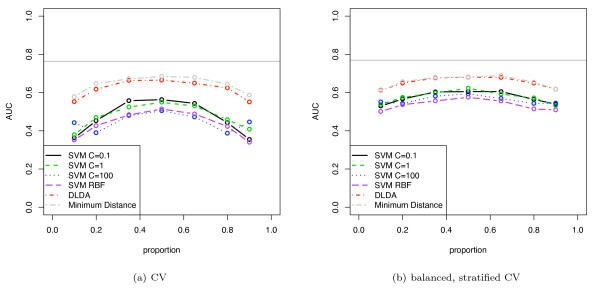
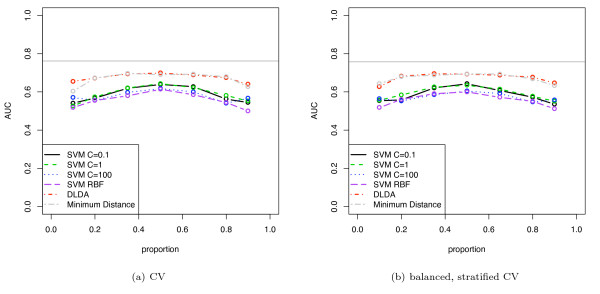
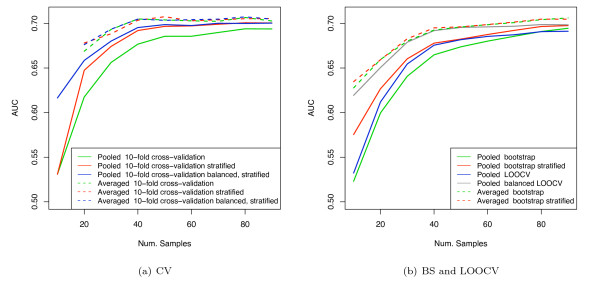
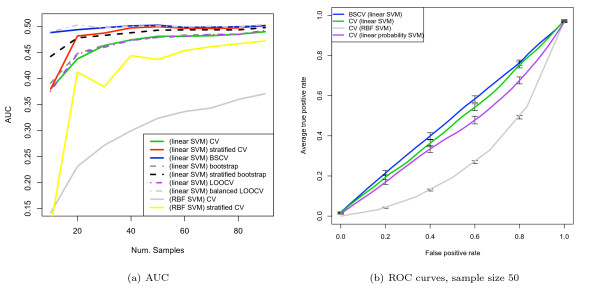
We show that when estimating the performance of classifiers on low signal datasets (i.e. those which are difficult to classify), which are typical of many prognostic microarray studies, commonly used performance measures can suffer from a substantial negative bias. For error rate this bias is only severe in quite restricted situations, but can be much larger and more frequent when using ranking measures such as the receiver operating characteristic (ROC) curve and area under the ROC (AUC). Substantial biases are shown in simulations and on the van 't Veer breast cancer dataset. The classification error rate can have large negative biases for balanced datasets, whereas the AUC shows substantial pessimistic biases even for imbalanced datasets. In simulation studies using 10-fold cross-validation, AUC values of less than 0.3 can be observed on random datasets rather than the expected 0.5. Further experiments on the van 't Veer breast cancer dataset show these biases exist in practice.

CONCLUSION

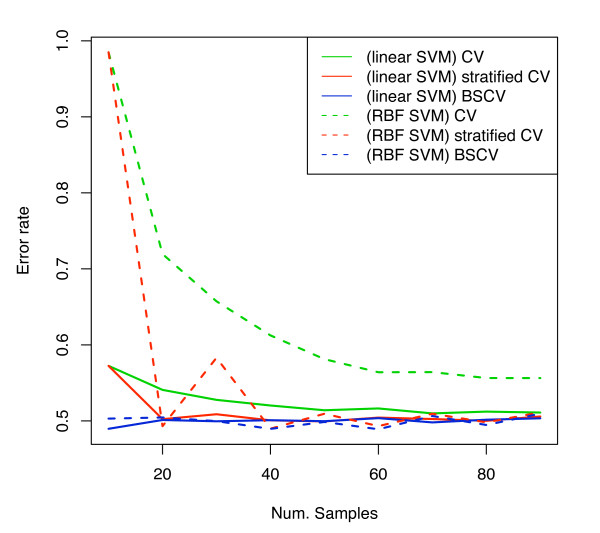
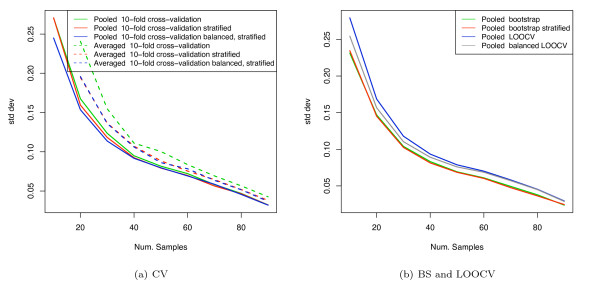
Stratification bias can substantially affect several performance measures. In computing the AUC, the strategy of pooling the test samples from the various folds of cross-validation can lead to large biases; computing it as the average of per-fold estimates avoids this bias and is thus the recommended approach. As a more general solution applicable to other performance measures, we show that stratified repeated holdout and a modified version of k-fold cross-validation, balanced, stratified cross-validation and balanced leave-one-out cross-validation, avoids the bias. Therefore for model selection and evaluation of microarray and other small biological datasets, these methods should be used and unstratified versions avoided. In particular, the commonly used (unbalanced) leave-one-out cross-validation should not be used to estimate AUC for small datasets.

摘要

背景

在分析微阵列及其他小样本量生物数据集时,需要注意避免各种偏差。我们分析了一种偏差形式,即分层偏差,它会严重影响使用样本重复验证技术的分析,并导致结果不准确。这种偏差是由于训练集和测试集中样本的分层不完善以及这些分层误差之间的相关性所致,即训练集和测试集中类别比例的变化呈负相关。

结果

我们表明,在估计分类器在低信号数据集(即难以分类的数据集)上的性能时,这在许多预后微阵列研究中很常见,常用的性能指标可能会遭受严重的负偏差。对于错误率,这种偏差仅在相当有限的情况下很严重,但在使用诸如接收者操作特征(ROC)曲线和ROC曲线下面积(AUC)等排序指标时,偏差可能更大且更频繁。在模拟和范特维尔乳腺癌数据集上均显示出严重的偏差。对于平衡数据集,分类错误率可能存在较大的负偏差,而即使对于不平衡数据集,AUC也显示出严重的悲观偏差。在使用10折交叉验证的模拟研究中,在随机数据集上可以观察到AUC值小于0.3,而不是预期的0.5。在范特维尔乳腺癌数据集上的进一步实验表明,这些偏差在实际中确实存在。

结论

分层偏差会严重影响多种性能指标。在计算AUC时,将交叉验证各折中的测试样本合并的策略可能会导致较大偏差;将其计算为每折估计值的平均值可避免这种偏差,因此是推荐的方法。作为适用于其他性能指标的更通用解决方案,我们表明分层重复留出法以及k折交叉验证的修改版本,即平衡分层交叉验证和平衡留一法交叉验证,可避免偏差。因此,对于微阵列和其他小生物数据集的模型选择和评估,应使用这些方法并避免使用未分层的版本。特别是,常用的(不平衡的)留一法交叉验证不应用于估计小数据集的AUC。

https://cdn.ncbi.nlm.nih.gov/pmc/blobs/24ba/2211509/f3432282e4e9/1471-2105-8-326-12.jpg
https://cdn.ncbi.nlm.nih.gov/pmc/blobs/24ba/2211509/cfce1c39bd3d/1471-2105-8-326-1.jpg
https://cdn.ncbi.nlm.nih.gov/pmc/blobs/24ba/2211509/43fae0990a2f/1471-2105-8-326-2.jpg
https://cdn.ncbi.nlm.nih.gov/pmc/blobs/24ba/2211509/2983ebc76dc8/1471-2105-8-326-3.jpg
https://cdn.ncbi.nlm.nih.gov/pmc/blobs/24ba/2211509/c2a31442282a/1471-2105-8-326-5.jpg
https://cdn.ncbi.nlm.nih.gov/pmc/blobs/24ba/2211509/b1e64d40dbb8/1471-2105-8-326-6.jpg
https://cdn.ncbi.nlm.nih.gov/pmc/blobs/24ba/2211509/6c3fd22db03b/1471-2105-8-326-7.jpg
https://cdn.ncbi.nlm.nih.gov/pmc/blobs/24ba/2211509/e6066de9b8e2/1471-2105-8-326-8.jpg
https://cdn.ncbi.nlm.nih.gov/pmc/blobs/24ba/2211509/f53e561a2147/1471-2105-8-326-4.jpg
https://cdn.ncbi.nlm.nih.gov/pmc/blobs/24ba/2211509/a7e27d77e567/1471-2105-8-326-9.jpg
https://cdn.ncbi.nlm.nih.gov/pmc/blobs/24ba/2211509/34eefd472845/1471-2105-8-326-10.jpg
https://cdn.ncbi.nlm.nih.gov/pmc/blobs/24ba/2211509/2c90c295f2d1/1471-2105-8-326-11.jpg
https://cdn.ncbi.nlm.nih.gov/pmc/blobs/24ba/2211509/f3432282e4e9/1471-2105-8-326-12.jpg

相似文献

1
Stratification bias in low signal microarray studies.低信号微阵列研究中的分层偏差。
BMC Bioinformatics. 2007 Sep 2;8:326. doi: 10.1186/1471-2105-8-326.
2
Regularized binormal ROC method in disease classification using microarray data.使用微阵列数据进行疾病分类的正则化双法线ROC方法。
BMC Bioinformatics. 2006 May 9;7:253. doi: 10.1186/1471-2105-7-253.
3
Improved variance estimation of classification performance via reduction of bias caused by small sample size.通过减少小样本量导致的偏差来改进分类性能的方差估计。
BMC Bioinformatics. 2006 Mar 13;7:127. doi: 10.1186/1471-2105-7-127.
4
Bias in error estimation when using cross-validation for model selection.在使用交叉验证进行模型选择时误差估计中的偏差。
BMC Bioinformatics. 2006 Feb 23;7:91. doi: 10.1186/1471-2105-7-91.
5
Classification based upon gene expression data: bias and precision of error rates.基于基因表达数据的分类:错误率的偏差与精度
Bioinformatics. 2007 Jun 1;23(11):1363-70. doi: 10.1093/bioinformatics/btm117. Epub 2007 Mar 28.
6
Estimating misclassification error with small samples via bootstrap cross-validation.通过自助法交叉验证用小样本估计误分类误差。
Bioinformatics. 2005 May 1;21(9):1979-86. doi: 10.1093/bioinformatics/bti294. Epub 2005 Feb 2.
7
Avoiding model selection bias in small-sample genomic datasets.避免小样本基因组数据集中的模型选择偏差。
Bioinformatics. 2006 May 15;22(10):1245-50. doi: 10.1093/bioinformatics/btl066. Epub 2006 Feb 24.
8
Evaluation of normalization methods for cDNA microarray data by k-NN classification.通过k近邻分类评估cDNA微阵列数据的标准化方法
BMC Bioinformatics. 2005 Jul 26;6:191. doi: 10.1186/1471-2105-6-191.
9
Meta-analysis of breast cancer microarray studies in conjunction with conserved cis-elements suggest patterns for coordinate regulation.结合保守顺式元件对乳腺癌微阵列研究进行的荟萃分析揭示了协同调控模式。
BMC Bioinformatics. 2008 Jan 28;9:63. doi: 10.1186/1471-2105-9-63.
10
Toward a measure of classification complexity in gene expression signatures.迈向基因表达特征中分类复杂性的一种度量方法。
Annu Int Conf IEEE Eng Med Biol Soc. 2008;2008:5704-7. doi: 10.1109/IEMBS.2008.4650509.

引用本文的文献

1
Prediction of Postoperative Pain and Side Effects of Patient-Controlled Analgesia in Pediatric Orthopedic Patients Using Machine Learning: A Retrospective Study.利用机器学习预测小儿骨科患者自控镇痛的术后疼痛及副作用:一项回顾性研究
J Clin Med. 2025 Feb 21;14(5):1459. doi: 10.3390/jcm14051459.
2
Automatic detection of CO rebreathing during BiPAP ventilation.BiPAP 通气时 CO 重复呼吸的自动检测。
Sci Rep. 2024 Aug 17;14(1):19066. doi: 10.1038/s41598-024-63609-4.
3
Paired evaluation of machine-learning models characterizes effects of confounders and outliers.

本文引用的文献

1
Critical review of published microarray studies for cancer outcome and guidelines on statistical analysis and reporting.已发表的癌症预后微阵列研究的批判性综述以及统计分析与报告指南。
J Natl Cancer Inst. 2007 Jan 17;99(2):147-57. doi: 10.1093/jnci/djk018.
2
Identifying genes that contribute most to good classification in microarrays.识别在微阵列中对良好分类贡献最大的基因。
BMC Bioinformatics. 2006 Sep 7;7:407. doi: 10.1186/1471-2105-7-407.
3
Bias in error estimation when using cross-validation for model selection.在使用交叉验证进行模型选择时误差估计中的偏差。
机器学习模型的配对评估可表征混杂因素和异常值的影响。
Patterns (N Y). 2023 Jul 7;4(8):100791. doi: 10.1016/j.patter.2023.100791. eCollection 2023 Aug 11.
4
A Probability-Based Models Ranking Approach: An Alternative Method of Machine-Learning Model Performance Assessment.基于概率的模型排名方法:一种机器学习模型性能评估的替代方法。
Sensors (Basel). 2022 Aug 24;22(17):6361. doi: 10.3390/s22176361.
5
Integrating deep learning and unbiased automated high-content screening to identify complex disease signatures in human fibroblasts.将深度学习与无偏自动化高内涵筛选相结合,以鉴定人类成纤维细胞中的复杂疾病特征。
Nat Commun. 2022 Mar 25;13(1):1590. doi: 10.1038/s41467-022-28423-4.
6
Mixed-methods evaluation of three natural language processing modeling approaches for measuring documented goals-of-care discussions in the electronic health record.混合方法评估三种自然语言处理建模方法在电子健康记录中测量记录的目标关怀讨论的效果。
J Pain Symptom Manage. 2022 Jun;63(6):e713-e723. doi: 10.1016/j.jpainsymman.2022.02.006. Epub 2022 Feb 16.
7
The Importance of Low Daily Risk for the Prediction of Treatment Events of Individual Dairy Cows with Sensor Systems.利用传感器系统预测个体奶牛的治疗事件,低日风险的重要性。
Sensors (Basel). 2021 Feb 17;21(4):1389. doi: 10.3390/s21041389.
8
Predictive Value of Breast MRI Background Parenchymal Enhancement for Neoadjuvant Treatment Response among HER2- Patients.HER2阴性患者中乳腺MRI背景实质强化对新辅助治疗反应的预测价值
J Breast Imaging. 2020 Aug;2(4):352-360. doi: 10.1093/jbi/wbaa028. Epub 2020 Jul 22.
9
Exploring the possibility of predicting human head hair greying from DNA using whole-exome and targeted NGS data.利用全外显子组和靶向 NGS 数据探索从 DNA 预测人类头部头发变白的可能性。
BMC Genomics. 2020 Aug 5;21(1):538. doi: 10.1186/s12864-020-06926-y.
10
Identification of dysregulated microRNAs in canine malignant melanoma.犬恶性黑色素瘤中失调的微小RNA的鉴定
Oncol Lett. 2019 Jan;17(1):1080-1088. doi: 10.3892/ol.2018.9692. Epub 2018 Nov 12.
BMC Bioinformatics. 2006 Feb 23;7:91. doi: 10.1186/1471-2105-7-91.
4
Avoiding model selection bias in small-sample genomic datasets.避免小样本基因组数据集中的模型选择偏差。
Bioinformatics. 2006 May 15;22(10):1245-50. doi: 10.1093/bioinformatics/btl066. Epub 2006 Feb 24.
5
ROCR: visualizing classifier performance in R.ROCR:在R语言中可视化分类器性能
Bioinformatics. 2005 Oct 15;21(20):3940-1. doi: 10.1093/bioinformatics/bti623. Epub 2005 Aug 11.
6
Prediction error estimation: a comparison of resampling methods.预测误差估计:重采样方法的比较
Bioinformatics. 2005 Aug 1;21(15):3301-7. doi: 10.1093/bioinformatics/bti499. Epub 2005 May 19.
7
Is cross-validation valid for small-sample microarray classification?交叉验证对小样本微阵列分类是否有效?
Bioinformatics. 2004 Feb 12;20(3):374-80. doi: 10.1093/bioinformatics/btg419.
8
Asymptotic behaviors of support vector machines with Gaussian kernel.具有高斯核的支持向量机的渐近行为
Neural Comput. 2003 Jul;15(7):1667-89. doi: 10.1162/089976603321891855.
9
Pitfalls in the use of DNA microarray data for diagnostic and prognostic classification.使用DNA微阵列数据进行诊断和预后分类时的陷阱。
J Natl Cancer Inst. 2003 Jan 1;95(1):14-8. doi: 10.1093/jnci/95.1.14.
10
Selection bias in gene extraction on the basis of microarray gene-expression data.基于微阵列基因表达数据进行基因提取时的选择偏倚。
Proc Natl Acad Sci U S A. 2002 May 14;99(10):6562-6. doi: 10.1073/pnas.102102699. Epub 2002 Apr 30.