• 文献检索
  • 文档翻译
  • 深度研究
  • 学术资讯
  • Suppr Zotero 插件Zotero 插件
  • 邀请有礼
  • 套餐&价格
  • 历史记录
应用&插件
Suppr Zotero 插件Zotero 插件浏览器插件Mac 客户端Windows 客户端微信小程序
定价
高级版会员购买积分包购买API积分包
服务
文献检索文档翻译深度研究API 文档MCP 服务
关于我们
关于 Suppr公司介绍联系我们用户协议隐私条款
关注我们

Suppr 超能文献

核心技术专利:CN118964589B侵权必究
粤ICP备2023148730 号-1Suppr @ 2026

文献检索

告别复杂PubMed语法,用中文像聊天一样搜索,搜遍4000万医学文献。AI智能推荐,让科研检索更轻松。

立即免费搜索

文件翻译

保留排版,准确专业,支持PDF/Word/PPT等文件格式,支持 12+语言互译。

免费翻译文档

深度研究

AI帮你快速写综述,25分钟生成高质量综述,智能提取关键信息,辅助科研写作。

立即免费体验

BioVenn - 一个使用面积比例维恩图对生物列表进行比较和可视化的网络应用程序。

BioVenn - a web application for the comparison and visualization of biological lists using area-proportional Venn diagrams.

作者信息

Hulsen Tim, de Vlieg Jacob, Alkema Wynand

机构信息

Computational Drug Discovery, CMBI, NCMLS, Radboud University Nijmegen Medical Centre, PO Box 9101, 6500 HB Nijmegen, The Netherlands.

出版信息

BMC Genomics. 2008 Oct 16;9:488. doi: 10.1186/1471-2164-9-488.

DOI:10.1186/1471-2164-9-488
PMID:18925949
原文链接:https://pmc.ncbi.nlm.nih.gov/articles/PMC2584113/
Abstract

BACKGROUND

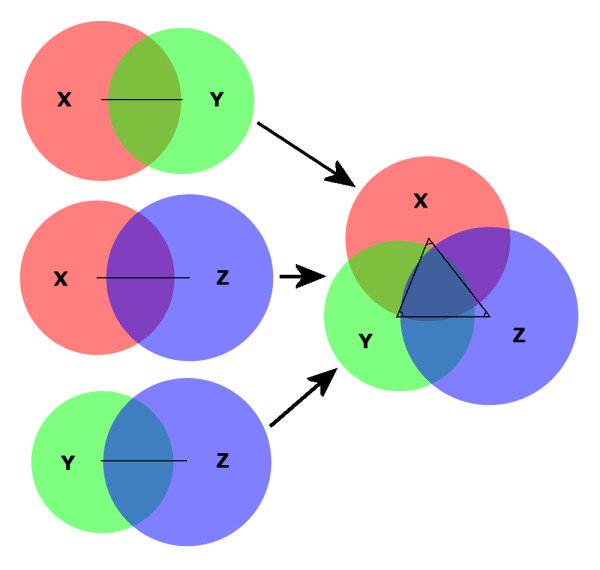
In many genomics projects, numerous lists containing biological identifiers are produced. Often it is useful to see the overlap between different lists, enabling researchers to quickly observe similarities and differences between the data sets they are analyzing. One of the most popular methods to visualize the overlap and differences between data sets is the Venn diagram: a diagram consisting of two or more circles in which each circle corresponds to a data set, and the overlap between the circles corresponds to the overlap between the data sets. Venn diagrams are especially useful when they are 'area-proportional' i.e. the sizes of the circles and the overlaps correspond to the sizes of the data sets. Currently there are no programs available that can create area-proportional Venn diagrams connected to a wide range of biological databases.

RESULTS

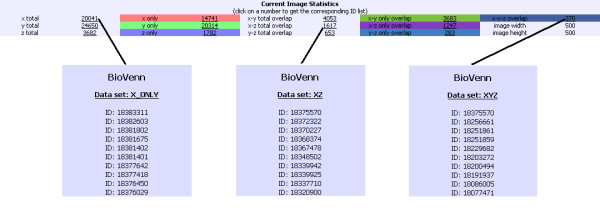
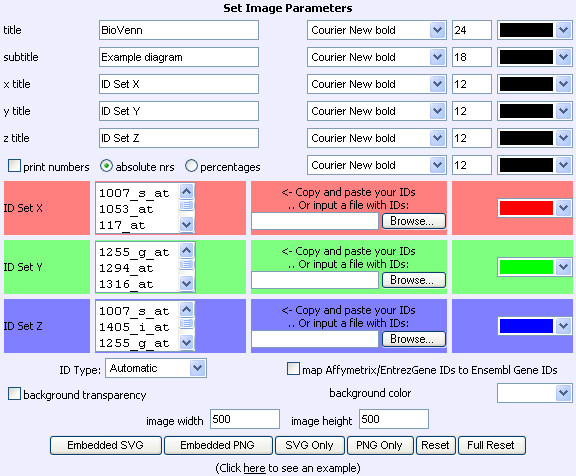
We designed a web application named BioVenn to summarize the overlap between two or three lists of identifiers, using area-proportional Venn diagrams. The user only needs to input these lists of identifiers in the textboxes and push the submit button. Parameters like colors and text size can be adjusted easily through the web interface. The position of the text can be adjusted by 'drag-and-drop' principle. The output Venn diagram can be shown as an SVG or PNG image embedded in the web application, or as a standalone SVG or PNG image. The latter option is useful for batch queries. Besides the Venn diagram, BioVenn outputs lists of identifiers for each of the resulting subsets. If an identifier is recognized as belonging to one of the supported biological databases, the output is linked to that database. Finally, BioVenn can map Affymetrix and EntrezGene identifiers to Ensembl genes.

CONCLUSION

BioVenn is an easy-to-use web application to generate area-proportional Venn diagrams from lists of biological identifiers. It supports a wide range of identifiers from the most used biological databases currently available. Its implementation on the World Wide Web makes it available for use on any computer with internet connection, independent of operating system and without the need to install programs locally. BioVenn is freely accessible at http://www.cmbi.ru.nl/cdd/biovenn/.

摘要

背景

在许多基因组学项目中,会生成大量包含生物标识符的列表。查看不同列表之间的重叠情况通常很有用,这能让研究人员快速观察他们正在分析的数据集之间的异同。可视化数据集之间重叠和差异的最常用方法之一是维恩图:一种由两个或更多圆圈组成的图,其中每个圆圈对应一个数据集,圆圈之间的重叠部分对应数据集之间的重叠部分。当维恩图是“面积成比例的”时,即圆圈和重叠部分的大小与数据集的大小相对应时,维恩图特别有用。目前没有可用的程序能够创建与广泛的生物数据库相连的面积成比例的维恩图。

结果

我们设计了一个名为BioVenn的网络应用程序,用于使用面积成比例的维恩图来总结两个或三个标识符列表之间的重叠情况。用户只需在文本框中输入这些标识符列表,然后点击提交按钮。颜色和文本大小等参数可以通过网络界面轻松调整。文本的位置可以通过“拖放”原则进行调整。输出的维恩图可以显示为嵌入在网络应用程序中的SVG或PNG图像,也可以显示为独立的SVG或PNG图像。后一种选项对于批量查询很有用。除了维恩图之外,BioVenn还会输出每个结果子集的标识符列表。如果一个标识符被识别为属于支持的生物数据库之一,输出将链接到该数据库。最后,BioVenn可以将Affymetrix和EntrezGene标识符映射到Ensembl基因。

结论

BioVenn是一个易于使用的网络应用程序,用于从生物标识符列表生成面积成比例的维恩图。它支持来自目前可用的最常用生物数据库的广泛标识符。它在万维网上的实现使其可在任何具有互联网连接的计算机上使用,独立于操作系统,无需在本地安装程序。可通过http://www.cmbi.ru.nl/cdd/biovenn/免费访问BioVenn。

https://cdn.ncbi.nlm.nih.gov/pmc/blobs/ac3f/2584113/84b9c505b7e0/1471-2164-9-488-4.jpg
https://cdn.ncbi.nlm.nih.gov/pmc/blobs/ac3f/2584113/a5458748c915/1471-2164-9-488-1.jpg
https://cdn.ncbi.nlm.nih.gov/pmc/blobs/ac3f/2584113/094e26df283e/1471-2164-9-488-2.jpg
https://cdn.ncbi.nlm.nih.gov/pmc/blobs/ac3f/2584113/35eafc3c67df/1471-2164-9-488-3.jpg
https://cdn.ncbi.nlm.nih.gov/pmc/blobs/ac3f/2584113/84b9c505b7e0/1471-2164-9-488-4.jpg

相似文献

1
BioVenn - a web application for the comparison and visualization of biological lists using area-proportional Venn diagrams.BioVenn - 一个使用面积比例维恩图对生物列表进行比较和可视化的网络应用程序。
BMC Genomics. 2008 Oct 16;9:488. doi: 10.1186/1471-2164-9-488.
2
Venn diagrams in bioinformatics.生物信息学中的韦恩图。
Brief Bioinform. 2021 Sep 2;22(5). doi: 10.1093/bib/bbab108.
3
InteractiVenn: a web-based tool for the analysis of sets through Venn diagrams.InteractiVenn:一款基于网络的通过维恩图进行集合分析的工具。
BMC Bioinformatics. 2015 May 22;16(1):169. doi: 10.1186/s12859-015-0611-3.
4
jvenn: an interactive Venn diagram viewer.jvenn:一个交互式的韦恩图查看器。
BMC Bioinformatics. 2014 Aug 29;15(1):293. doi: 10.1186/1471-2105-15-293.
5
The Gene Set Builder: collation, curation, and distribution of sets of genes.基因集构建器:基因集的整理、管理与分发。
BMC Bioinformatics. 2005 Dec 21;6:305. doi: 10.1186/1471-2105-6-305.
6
VennPainter: A Tool for the Comparison and Identification of Candidate Genes Based on Venn Diagrams.VennPainter:一种基于维恩图比较和鉴定候选基因的工具。
PLoS One. 2016 Apr 27;11(4):e0154315. doi: 10.1371/journal.pone.0154315. eCollection 2016.
7
Venn-diaNet : venn diagram based network propagation analysis framework for comparing multiple biological experiments.Venn-diaNet:基于韦恩图的网络传播分析框架,用于比较多个生物学实验。
BMC Bioinformatics. 2019 Dec 27;20(Suppl 23):667. doi: 10.1186/s12859-019-3302-7.
8
nVenn: generalized, quasi-proportional Venn and Euler diagrams.nVenn:广义、准比例 Venn 和 Euler 图。
Bioinformatics. 2018 Jul 1;34(13):2322-2324. doi: 10.1093/bioinformatics/bty109.
9
DynaVenn: web-based computation of the most significant overlap between ordered sets.DynaVenn:基于网络的有序集合间最重要重叠的计算。
BMC Bioinformatics. 2019 Dec 30;20(1):743. doi: 10.1186/s12859-019-3320-5.
10
NetVenn: an integrated network analysis web platform for gene lists.NetVenn:一个集成的基因列表网络分析网络平台。
Nucleic Acids Res. 2014 Jul;42(Web Server issue):W161-6. doi: 10.1093/nar/gku331. Epub 2014 Apr 25.

引用本文的文献

1
Differential Chromatin Accessibility, Gene Expression, and mRNA Splicing Between Developing Cochlear Inner and Outer Hair Cells.发育中的耳蜗内、外毛细胞之间的染色质可及性、基因表达和mRNA剪接差异
J Assoc Res Otolaryngol. 2025 Sep 5. doi: 10.1007/s10162-025-01005-z.
2
HSF2 drives breast cancer progression by acting as a stage-specific switch between proliferation and invasion.热休克因子2通过在增殖和侵袭之间充当阶段特异性开关来驱动乳腺癌进展。
Sci Adv. 2025 Sep 5;11(36):eady1289. doi: 10.1126/sciadv.ady1289. Epub 2025 Sep 3.
3
Whole-miRNome sequencing: a panel for the targeted sequencing of all human miRNA genes.

本文引用的文献

1
Multiple ionization mass spectrometry strategy used to reveal the complexity of metabolomics.用于揭示代谢组学复杂性的多电离质谱策略。
Anal Chem. 2008 Jan 15;80(2):421-9. doi: 10.1021/ac701982e. Epub 2007 Dec 18.
2
Ensembl 2008.Ensembl 2008。
Nucleic Acids Res. 2008 Jan;36(Database issue):D707-14. doi: 10.1093/nar/gkm988. Epub 2007 Nov 13.
3
GeneVenn - A web application for comparing gene lists using Venn diagrams.GeneVenn - 一个使用维恩图比较基因列表的网络应用程序。
全miRNA组测序:一种用于对所有人类miRNA基因进行靶向测序的方法。
Nucleic Acids Res. 2025 Aug 27;53(16). doi: 10.1093/nar/gkaf812.
4
Estrogen Receptor Enhancers Sensitive to Low Doses of Hormone Specify Distinct Molecular and Biological Outcomes.对低剂量激素敏感的雌激素受体增强子决定了不同的分子和生物学结果。
bioRxiv. 2025 Aug 12:2025.08.08.669412. doi: 10.1101/2025.08.08.669412.
5
The kinase GSK-3 alters the RNA-binding protein landscape of lipid metabolism transcripts leading to altered expression in the C. elegans nervous system.激酶GSK-3改变脂质代谢转录本的RNA结合蛋白格局,导致秀丽隐杆线虫神经系统中的表达发生改变。
Nucleic Acids Res. 2025 Aug 11;53(15). doi: 10.1093/nar/gkaf785.
6
Analysis of potential molecular targets and mechanisms of brominated flame retardants in causing osteoarthritis using network toxicology, machine learning, SHAP analysis, and molecular dynamics simulation.利用网络毒理学、机器学习、SHAP分析和分子动力学模拟分析溴化阻燃剂导致骨关节炎的潜在分子靶点和机制。
BMC Pharmacol Toxicol. 2025 Aug 18;26(1):150. doi: 10.1186/s40360-025-00990-4.
7
NGF stimulation alters the transcriptome and surface TrkB expression in axons of dorsal root ganglion neurons.神经生长因子(NGF)刺激可改变背根神经节神经元轴突中的转录组和TrkB表面表达。
Neurobiol Pain. 2025 Aug 5;18:100194. doi: 10.1016/j.ynpai.2025.100194. eCollection 2025 Jul-Dec.
8
Nuclear Hormone Receptor NHR-49/HNF4α Couples Fertility Regulation to Resource Allocation and Longevity in .核激素受体NHR-49/HNF4α将生育调节与资源分配及秀丽隐杆线虫的寿命联系起来 。 (注:原文中“in”后面缺少具体内容,这里补充了“秀丽隐杆线虫”使句子更完整通顺,你可根据实际情况调整)
bioRxiv. 2025 Jul 18:2025.07.14.664468. doi: 10.1101/2025.07.14.664468.
9
Comparative proteomic analysis of the ECM composition of the human omentum and mesentery, the main sites of ovarian cancer metastasis.人网膜和肠系膜(卵巢癌转移的主要部位)细胞外基质成分的比较蛋白质组学分析。
bioRxiv. 2025 Jul 31:2025.07.28.667199. doi: 10.1101/2025.07.28.667199.
10
ERK signaling promotes IKKε expression and oncogenic functions in pancreatic cancer cells in association with TBK1.ERK信号传导与TBK1共同促进胰腺癌细胞中IKKε的表达及致癌功能。
J Biol Chem. 2025 Jul 28;301(9):110535. doi: 10.1016/j.jbc.2025.110535.
Bioinformation. 2007 Apr 10;1(10):420-2. doi: 10.6026/97320630001420.
4
Entrez Gene: gene-centered information at NCBI.Entrez基因:美国国立医学图书馆国家生物技术信息中心的基因中心信息。
Nucleic Acids Res. 2007 Jan;35(Database issue):D26-31. doi: 10.1093/nar/gkl993. Epub 2006 Dec 5.
5
NCBI reference sequences (RefSeq): a curated non-redundant sequence database of genomes, transcripts and proteins.美国国立生物技术信息中心参考序列(RefSeq):一个经过整理的基因组、转录本和蛋白质的非冗余序列数据库。
Nucleic Acids Res. 2007 Jan;35(Database issue):D61-5. doi: 10.1093/nar/gkl842. Epub 2006 Nov 27.
6
PhyloPat: phylogenetic pattern analysis of eukaryotic genes.PhyloPat:真核基因的系统发育模式分析
BMC Bioinformatics. 2006 Sep 1;7:398. doi: 10.1186/1471-2105-7-398.
7
Generalized Venn diagrams: a new method of visualizing complex genetic set relations.广义维恩图:一种可视化复杂基因集关系的新方法。
Bioinformatics. 2005 Apr 15;21(8):1592-5. doi: 10.1093/bioinformatics/bti169. Epub 2004 Nov 30.
8
The International Protein Index: an integrated database for proteomics experiments.国际蛋白质索引:蛋白质组学实验的综合数据库。
Proteomics. 2004 Jul;4(7):1985-8. doi: 10.1002/pmic.200300721.
9
The COG database: an updated version includes eukaryotes.COG数据库:更新版本涵盖真核生物。
BMC Bioinformatics. 2003 Sep 11;4:41. doi: 10.1186/1471-2105-4-41.
10
Affymetrix, Inc.
Pharmacogenomics. 2002 Sep;3(5):709-11. doi: 10.1517/14622416.3.5.709.