• 文献检索
  • 文档翻译
  • 深度研究
  • 学术资讯
  • Suppr Zotero 插件Zotero 插件
  • 邀请有礼
  • 套餐&价格
  • 历史记录
应用&插件
Suppr Zotero 插件Zotero 插件浏览器插件Mac 客户端Windows 客户端微信小程序
定价
高级版会员购买积分包购买API积分包
服务
文献检索文档翻译深度研究API 文档MCP 服务
关于我们
关于 Suppr公司介绍联系我们用户协议隐私条款
关注我们

Suppr 超能文献

核心技术专利:CN118964589B侵权必究
粤ICP备2023148730 号-1Suppr @ 2026

文献检索

告别复杂PubMed语法,用中文像聊天一样搜索,搜遍4000万医学文献。AI智能推荐,让科研检索更轻松。

立即免费搜索

文件翻译

保留排版,准确专业,支持PDF/Word/PPT等文件格式,支持 12+语言互译。

免费翻译文档

深度研究

AI帮你快速写综述,25分钟生成高质量综述,智能提取关键信息,辅助科研写作。

立即免费体验

智能密度:一种更精确的测量农村居民密度的方法,用于与健康相关的研究。

Smart density: A more accurate method of measuring rural residential density for health-related research.

机构信息

Smart Mobility, Inc., Norwich, Vermont 05055, USA.

出版信息

Int J Health Geogr. 2010 Feb 12;9:8. doi: 10.1186/1476-072X-9-8.

DOI:10.1186/1476-072X-9-8
PMID:20152044
原文链接:https://pmc.ncbi.nlm.nih.gov/articles/PMC2831851/
Abstract

BACKGROUND

Studies involving the built environment have typically relied on US Census data to measure residential density. However, census geographic units are often unsuited to health-related research, especially in rural areas where development is clustered and discontinuous.

OBJECTIVE

We evaluated the accuracy of both standard census methods and alternative GIS-based methods to measure rural density.

METHODS

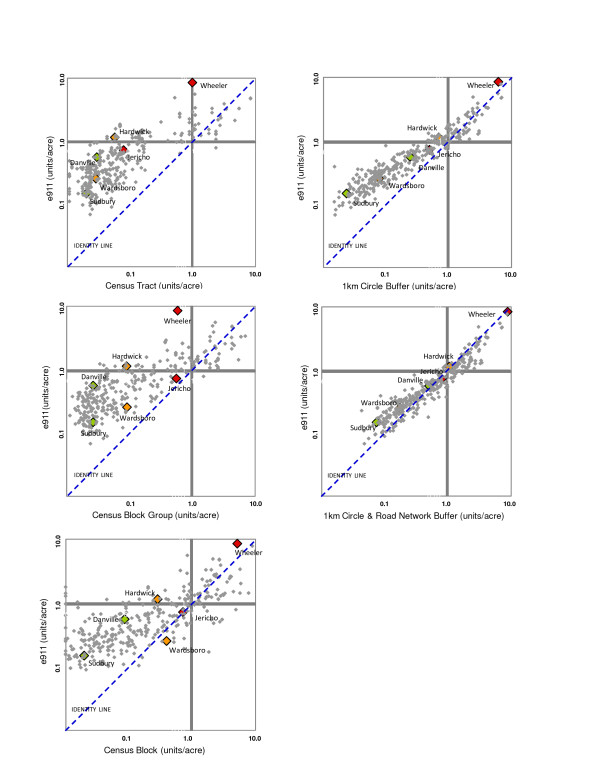
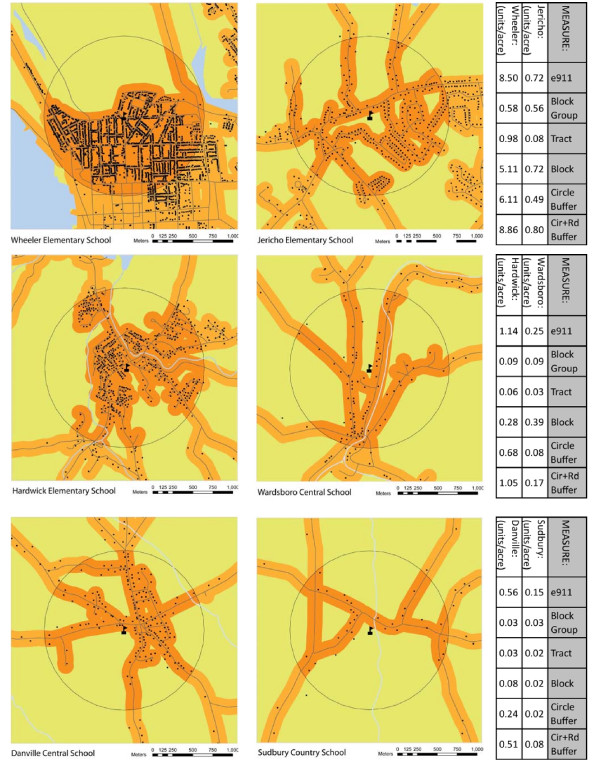
We compared residential density (units/acre) in 335 Vermont school neighborhoods using conventional census geographic units (tract, block group and block) with two GIS buffer measures: a 1-kilometer (km) circle around the school and a 1-km circle intersected with a 100-meter (m) road-network buffer. The accuracy of each method was validated against the actual residential density for each neighborhood based on the Vermont e911 database, which provides an exact geo-location for all residential structures in the state.

RESULTS

Standard census measures underestimate residential density in rural areas. In addition, the degree of error is inconsistent so even the relative rank of neighborhood densities varies across census measures. Census measures explain only 61% to 66% of the variation in actual residential density. In contrast, GIS buffer measures explain approximately 90% of the variation. Combining a 1-km circle with a road-network buffer provides the closest approximation of actual residential density.

CONCLUSION

Residential density based on census units can mask clusters of development in rural areas and distort associations between residential density and health-related behaviors and outcomes. GIS-defined buffers, including a 1-km circle and a road-network buffer, can be used in conjunction with census data to obtain a more accurate measure of residential density.

摘要

背景

涉及建筑环境的研究通常依赖美国人口普查数据来衡量居民密度。然而,人口普查的地理单位通常不适合与健康相关的研究,尤其是在农村地区,那里的发展是集聚和不连续的。

目的

我们评估了标准人口普查方法和替代 GIS 方法测量农村密度的准确性。

方法

我们比较了 335 个佛蒙特州学校社区的住宅密度(单位/英亩),使用传统的人口普查地理单位(普查区、街区组和街区)与两种 GIS 缓冲区方法:学校周围 1 公里(km)的圆圈和与 100 米(m)道路网络缓冲区相交的 1 公里圆圈。每种方法的准确性都根据佛蒙特州 e911 数据库(为该州所有住宅结构提供精确地理位置)对每个社区的实际住宅密度进行了验证。

结果

标准人口普查措施低估了农村地区的住宅密度。此外,误差程度不一致,因此即使是社区密度的相对等级也因人口普查措施而异。人口普查措施仅解释了实际住宅密度的 61%至 66%。相比之下,GIS 缓冲区措施解释了大约 90%的变化。结合 1 公里的圆圈和道路网络缓冲区可以最接近实际住宅密度。

结论

基于普查单位的住宅密度可能掩盖农村地区的发展集群,并扭曲住宅密度与健康相关行为和结果之间的关联。GIS 定义的缓冲区,包括 1 公里的圆圈和道路网络缓冲区,可以与人口普查数据结合使用,以获得更准确的住宅密度测量值。

https://cdn.ncbi.nlm.nih.gov/pmc/blobs/7996/2831851/e01785ca464a/1476-072X-9-8-2.jpg
https://cdn.ncbi.nlm.nih.gov/pmc/blobs/7996/2831851/d63c3e11c6cd/1476-072X-9-8-1.jpg
https://cdn.ncbi.nlm.nih.gov/pmc/blobs/7996/2831851/e01785ca464a/1476-072X-9-8-2.jpg
https://cdn.ncbi.nlm.nih.gov/pmc/blobs/7996/2831851/d63c3e11c6cd/1476-072X-9-8-1.jpg
https://cdn.ncbi.nlm.nih.gov/pmc/blobs/7996/2831851/e01785ca464a/1476-072X-9-8-2.jpg

相似文献

1
Smart density: A more accurate method of measuring rural residential density for health-related research.智能密度:一种更精确的测量农村居民密度的方法,用于与健康相关的研究。
Int J Health Geogr. 2010 Feb 12;9:8. doi: 10.1186/1476-072X-9-8.
2
Establishing the soundness of administrative spatial units for operationalising the active living potential of residential environments: an exemplar for designing optimal zones.确立用于实现居住环境积极生活潜力的行政空间单元的合理性:设计最佳区域的一个范例
Int J Health Geogr. 2008 Jul 31;7:43. doi: 10.1186/1476-072X-7-43.
3
Evaluation of geoimputation strategies in a large case study.在一项大型案例研究中评估地理推断策略。
Int J Health Geogr. 2018 Jul 31;17(1):30. doi: 10.1186/s12942-018-0151-y.
4
Comparing self-identified and census-defined neighborhoods among adolescents using GPS and accelerometer.利用 GPS 和加速度计比较青少年的自我认同和人口普查定义的邻里关系。
Int J Health Geogr. 2013 Dec 10;12:57. doi: 10.1186/1476-072X-12-57.
5
Identification of contrastive and comparable school neighborhoods for childhood obesity and physical activity research.识别用于儿童肥胖和身体活动研究的对比性和可比性学校社区。
Int J Health Geogr. 2006 Mar 30;5:14. doi: 10.1186/1476-072X-5-14.
6
Non-residential neighborhood exposures suppress neighborhood effects on self-rated health.非居住社区暴露会抑制社区对自评健康的影响。
Soc Sci Med. 2007 Oct;65(8):1779-91. doi: 10.1016/j.socscimed.2007.05.051. Epub 2007 Jul 5.
7
Evaluating heterogeneity in indoor and outdoor air pollution using land-use regression and constrained factor analysis.利用土地利用回归和约束因子分析评估室内和室外空气污染的异质性。
Res Rep Health Eff Inst. 2010 Dec(152):5-80; discussion 81-91.
8
Modeling Pediatric Body Mass Index and Neighborhood Environment at Different Spatial Scales.建立不同空间尺度下的儿童体质量指数与社区环境模型。
Int J Environ Res Public Health. 2018 Mar 8;15(3):473. doi: 10.3390/ijerph15030473.
9
Analyses of school commuting data for exposure modeling purposes.用于暴露建模目的的上学通勤数据分析。
J Expo Sci Environ Epidemiol. 2010 Jan;20(1):69-78. doi: 10.1038/jes.2009.3. Epub 2009 Feb 25.
10
High school census tract information predicts practice in rural and minority communities.高中普查区信息可预测农村和少数族裔社区的医疗服务情况。
J Rural Health. 2005 Summer;21(3):228-32. doi: 10.1111/j.1748-0361.2005.tb00087.x.

引用本文的文献

1
Exploring the complex associations between community public spaces and healthy aging: an explainable analysis using catboost and SHAP.探索社区公共空间与健康老龄化之间的复杂关联:使用CatBoost和SHAP的可解释性分析
BMC Public Health. 2025 Jul 2;25(1):2200. doi: 10.1186/s12889-025-23402-y.
2
Analysis of the Spatial and Temporal Evolution of Urban Resilience in Four Southern Regions of Xinjiang.分析新疆南部四地区城市韧性的时空演变。
Int J Environ Res Public Health. 2023 Mar 14;20(6):5106. doi: 10.3390/ijerph20065106.
3
Smart city lifestyle sensing, big data, geo-analytics and intelligence for smarter public health decision-making in overweight, obesity and type 2 diabetes prevention: the research we should be doing.

本文引用的文献

1
The built environment and obesity.建筑环境与肥胖
Epidemiol Rev. 2007;29:129-43. doi: 10.1093/epirev/mxm009. Epub 2007 May 28.
2
Protective association between neighborhood walkability and depression in older men.老年男性邻里步行便利性与抑郁症之间的保护性关联。
J Am Geriatr Soc. 2007 Apr;55(4):526-33. doi: 10.1111/j.1532-5415.2007.01108.x.
3
Defining urban and rural areas in U.S. epidemiologic studies.在美国流行病学研究中定义城乡地区。
智慧城市生活感知、大数据、地理分析和智能技术在超重、肥胖和 2 型糖尿病预防中的应用,为更明智的公共卫生决策提供依据:这是我们应该开展的研究。
Int J Health Geogr. 2021 Mar 3;20(1):12. doi: 10.1186/s12942-021-00266-0.
4
Land use planning and wildfire: development policies influence future probability of housing loss.土地利用规划与野火:发展政策影响未来住房损失的概率。
PLoS One. 2013 Aug 14;8(8):e71708. doi: 10.1371/journal.pone.0071708. eCollection 2013.
5
Do adolescents who live or go to school near fast-food restaurants eat more frequently from fast-food restaurants?居住或上学地点附近有快餐店的青少年是否更频繁地从快餐店就餐?
Health Place. 2012 Nov;18(6):1261-9. doi: 10.1016/j.healthplace.2012.09.005. Epub 2012 Sep 15.
6
Neighborhood built environment and physical activity of Japanese older adults: results from the Aichi Gerontological Evaluation Study (AGES).日本老年人的邻里建成环境与身体活动:爱知老年人评估研究(AGES)的结果。
BMC Public Health. 2011 Aug 19;11:657. doi: 10.1186/1471-2458-11-657.
7
Public directory data sources do not accurately characterize the food environment in two predominantly rural states.公共目录数据源无法准确描述两个主要为农村地区的州的食品环境。
J Am Diet Assoc. 2011 Apr;111(4):577-82. doi: 10.1016/j.jada.2011.01.008.
8
Built environment predictors of active travel to school among rural adolescents.农村青少年与积极上学相关的建成环境预测因素。
Am J Prev Med. 2011 Mar;40(3):312-9. doi: 10.1016/j.amepre.2010.11.008.
J Urban Health. 2006 Mar;83(2):162-75. doi: 10.1007/s11524-005-9016-3.
4
The link between obesity and the built environment. Evidence from an ecological analysis of obesity and vehicle miles of travel in California.肥胖与建成环境之间的联系。来自加利福尼亚州肥胖与车辆行驶里程生态分析的证据。
Health Place. 2006 Dec;12(4):656-64. doi: 10.1016/j.healthplace.2005.09.001. Epub 2005 Oct 25.
5
Obesity and the built environment.肥胖与建筑环境。
J Am Diet Assoc. 2005 May;105(5 Suppl 1):S110-7. doi: 10.1016/j.jada.2005.02.045.
6
Urban sprawl and risk for being overweight or obese.城市扩张与超重或肥胖风险
Am J Public Health. 2004 Sep;94(9):1574-9. doi: 10.2105/ajph.94.9.1574.
7
Obesity relationships with community design, physical activity, and time spent in cars.肥胖与社区设计、身体活动以及在汽车中花费的时间之间的关系。
Am J Prev Med. 2004 Aug;27(2):87-96. doi: 10.1016/j.amepre.2004.04.011.
8
Relationship between urban sprawl and physical activity, obesity, and morbidity.城市扩张与身体活动、肥胖及发病率之间的关系。
Am J Health Promot. 2003 Sep-Oct;18(1):47-57. doi: 10.4278/0890-1171-18.1.47.
9
Neighborhood-based differences in physical activity: an environment scale evaluation.基于社区的身体活动差异:一项环境量表评估
Am J Public Health. 2003 Sep;93(9):1552-8. doi: 10.2105/ajph.93.9.1552.
10
Environmental correlates of walking and cycling: findings from the transportation, urban design, and planning literatures.步行与骑行的环境关联因素:来自交通、城市设计与规划文献的研究发现
Ann Behav Med. 2003 Spring;25(2):80-91. doi: 10.1207/S15324796ABM2502_03.