Institute for Health Metrics and Evaluation, University of Washington, Seattle, Washington, United States of America.
PLoS Med. 2010 Aug 17;7(8):e1000328. doi: 10.1371/journal.pmed.1000328.
Development assistance for health (DAH) targeted at malaria has risen exponentially over the last 10 years, with a large fraction of these resources directed toward the distribution of insecticide-treated bed nets (ITNs). Identifying countries that have been successful in scaling up ITN coverage and understanding the role of DAH is critical for making progress in countries where coverage remains low. Sparse and inconsistent sources of data have prevented robust estimates of the coverage of ITNs over time.
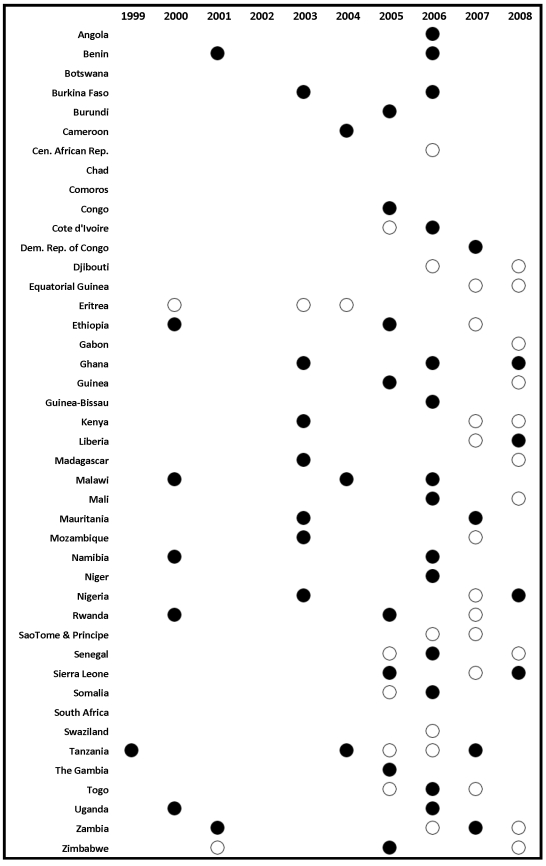
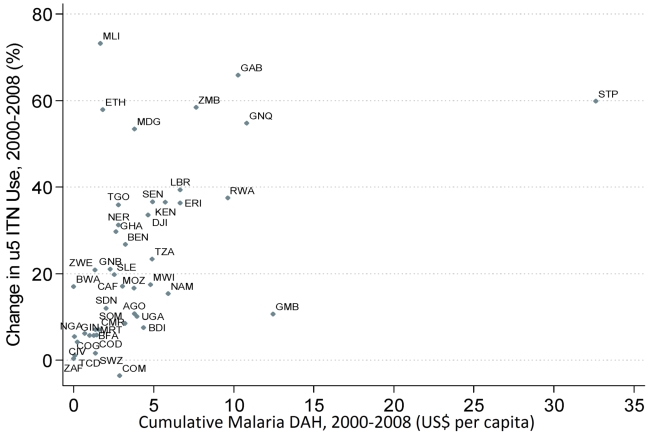
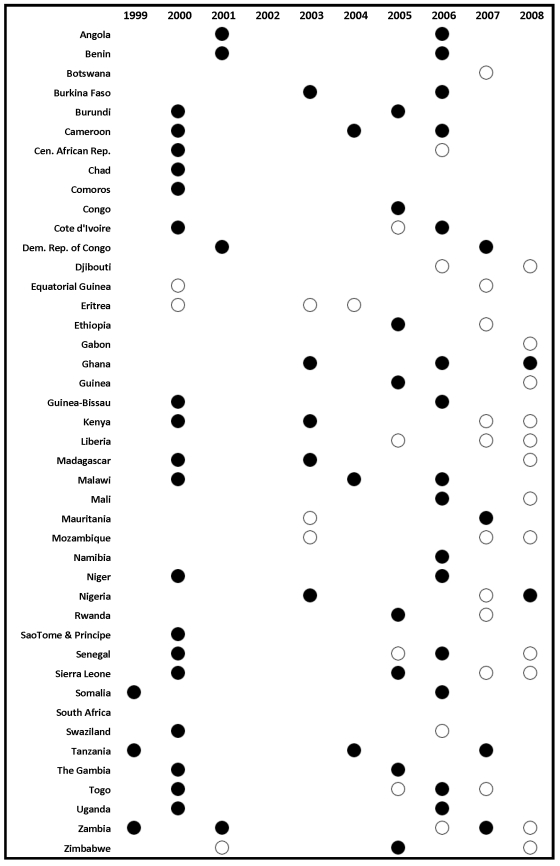
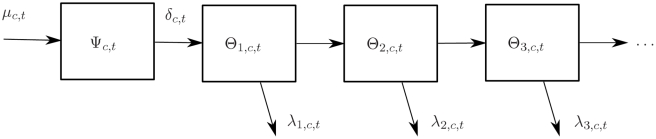
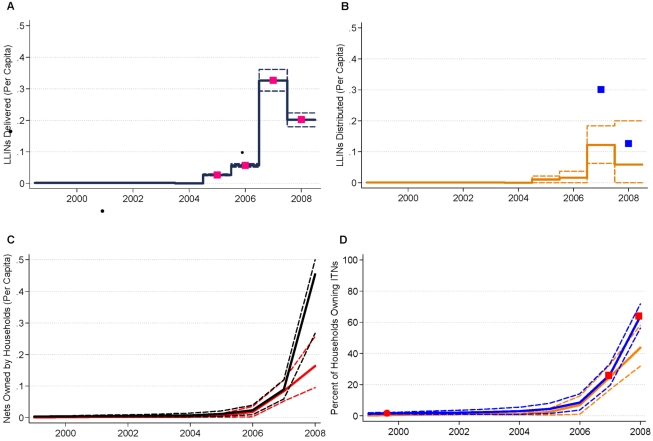
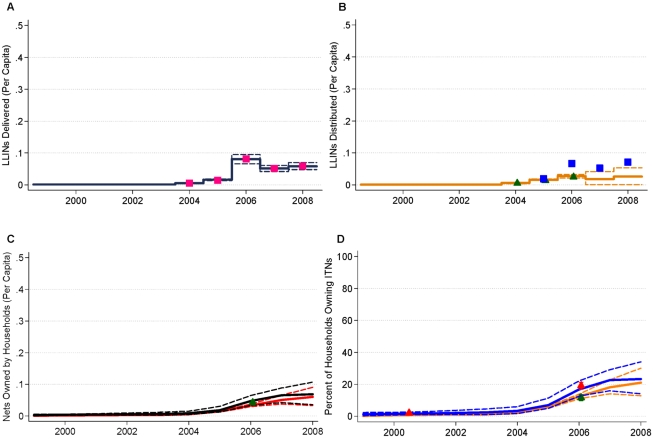
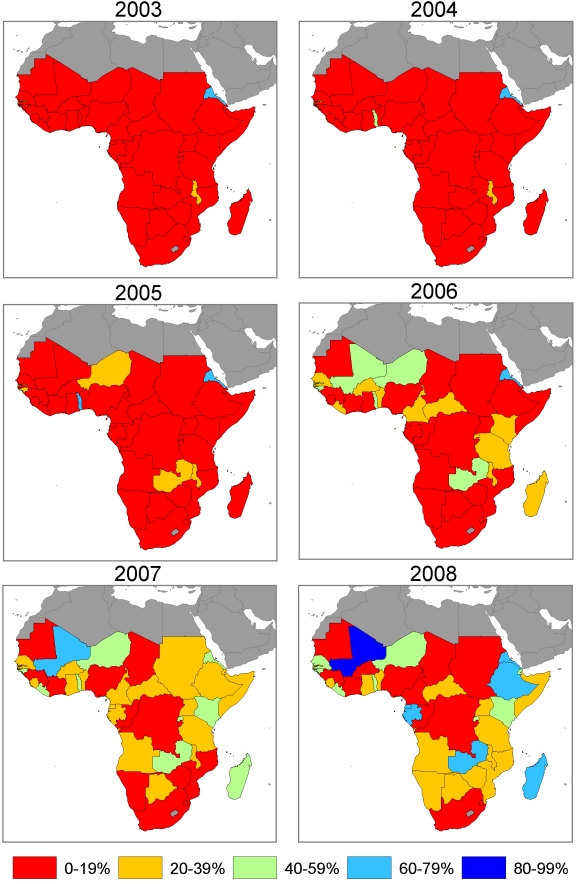
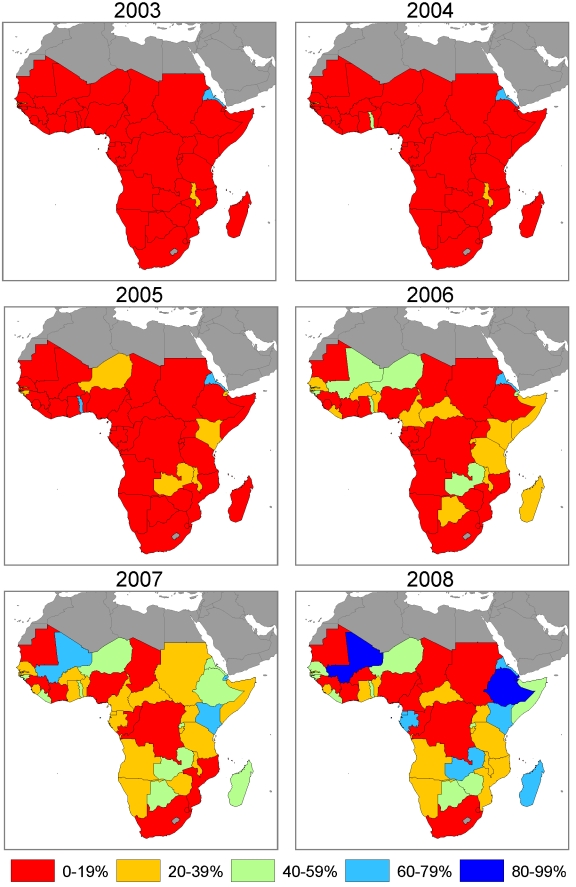
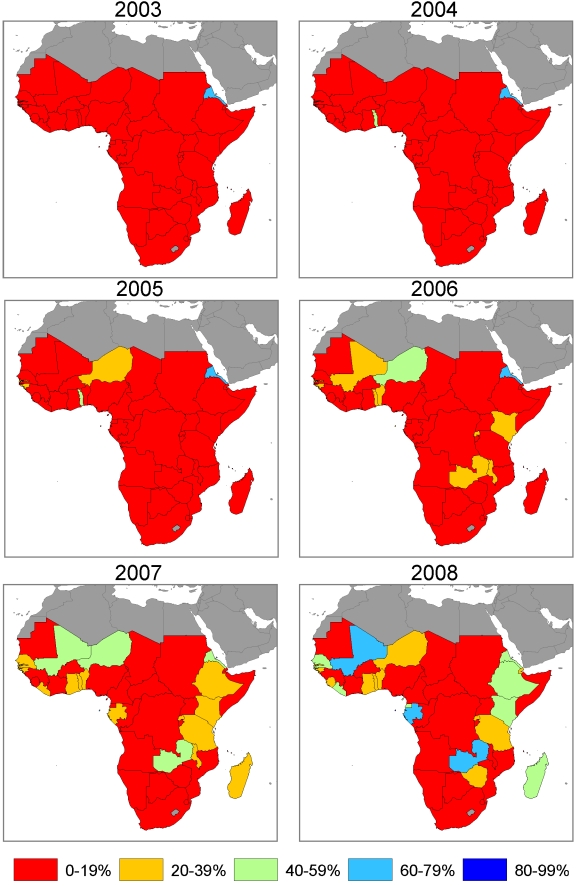
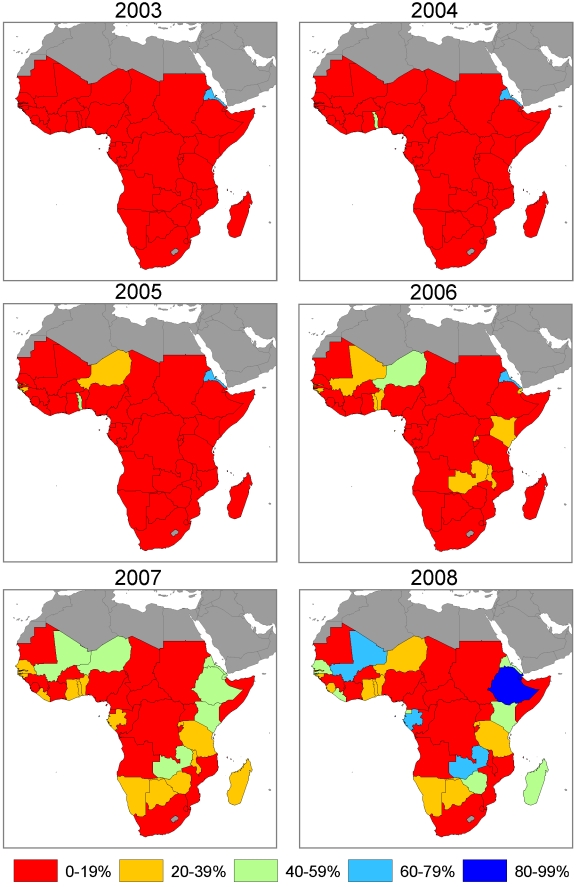
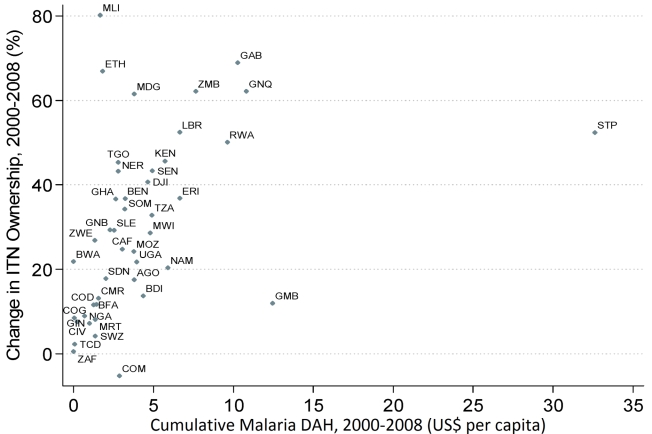
We combined data from manufacturer reports of ITN deliveries to countries, National Malaria Control Program (NMCP) reports of ITNs distributed to health facilities and operational partners, and household survey data using Bayesian inference on a deterministic compartmental model of ITN distribution. For 44 countries in Africa, we calculated (1) ITN ownership coverage, defined as the proportion of households that own at least one ITN, and (2) ITN use in children under 5 coverage, defined as the proportion of children under the age of 5 years who slept under an ITN. Using regression, we examined the relationship between cumulative DAH targeted at malaria between 2000 and 2008 and the change in national-level ITN coverage over the same time period. In 1999, assuming that all ITNs are owned and used in populations at risk of malaria, mean coverage of ITN ownership and use in children under 5 among populations at risk of malaria were 2.2% and 1.5%, respectively, and were uniformly low across all 44 countries. In 2003, coverage of ITN ownership and use in children under 5 was 5.1% (95% uncertainty interval 4.6% to 5.7%) and 3.7% (2.9% to 4.9%); in 2006 it was 17.5% (16.4% to 18.8%) and 12.9% (10.8% to 15.4%); and by 2008 it was 32.8% (31.4% to 34.4%) and 26.6% (22.3% to 30.9%), respectively. In 2008, four countries had ITN ownership coverage of 80% or greater; six countries were between 60% and 80%; nine countries were between 40% and 60%; 12 countries were between 20% and 40%; and 13 countries had coverage below 20%. Excluding four outlier countries, each US$1 per capita in malaria DAH was associated with a significant increase in ITN household coverage and ITN use in children under 5 coverage of 5.3 percentage points (3.7 to 6.9) and 4.6 percentage points (2.5 to 6.7), respectively.
Rapid increases in ITN coverage have occurred in some of the poorest countries, but coverage remains low in large populations at risk. DAH targeted at malaria can lead to improvements in ITN coverage; inadequate financing may be a reason for lack of progress in some countries. Please see later in the article for the Editors' Summary.
过去 10 年来,针对疟疾的发展援助(DAH)呈指数级增长,其中很大一部分资源用于分发驱虫蚊帐(ITN)。确定成功扩大 ITN 覆盖范围的国家,并了解 DAH 的作用,对于在覆盖范围仍然较低的国家取得进展至关重要。数据来源稀疏且不一致,使得对 ITN 覆盖范围的可靠估计变得困难。
我们结合了制造商报告的 ITN 交付给各国的数据、国家疟疾控制规划(NMCP)报告的 ITN 分发给卫生机构和业务伙伴的数据,以及使用贝叶斯推理对 ITN 分配的确定性隔室模型进行的家庭调查数据。对于非洲的 44 个国家,我们计算了:(1)ITN 拥有率覆盖,定义为拥有至少一个 ITN 的家庭比例;(2)5 岁以下儿童使用 ITN 的覆盖率,定义为年龄在 5 岁以下的儿童中使用 ITN 的比例。我们使用回归分析,研究了 2000 年至 2008 年期间疟疾专项 DAH 与同期国家一级 ITN 覆盖范围变化之间的关系。在 1999 年,假设所有 ITN 都为疟疾风险人群所有并使用,那么疟疾风险人群中 5 岁以下儿童 ITN 拥有率和使用率的平均值分别为 2.2%和 1.5%,且在所有 44 个国家中均较低。2003 年,5 岁以下儿童 ITN 拥有率和使用率分别为 5.1%(95%置信区间 4.6%至 5.7%)和 3.7%(2.9%至 4.9%);2006 年分别为 17.5%(16.4%至 18.8%)和 12.9%(10.8%至 15.4%);到 2008 年,分别为 32.8%(31.4%至 34.4%)和 26.6%(22.3%至 30.9%)。2008 年,有四个国家的 ITN 拥有率覆盖率达到 80%或更高;六个国家在 60%至 80%之间;九个国家在 40%至 60%之间;12 个国家在 20%至 40%之间;13 个国家的覆盖率低于 20%。在排除四个异常值国家后,疟疾专项 DAH 人均每增加 1 美元,与 ITN 家庭覆盖率和 5 岁以下儿童 ITN 使用率分别显著增加 5.3 个百分点(3.7 至 6.9)和 4.6 个百分点(2.5 至 6.7)相关。
一些最贫穷的国家的 ITN 覆盖率迅速提高,但仍有大量高风险人群的覆盖率较低。疟疾专项 DAH 可以提高 ITN 覆盖率;在一些国家,资金不足可能是缺乏进展的原因。请在文章后面查看编辑摘要。