Department of Psychiatry, University of Hong Kong, Hong Kong, China.
PLoS Genet. 2010 Dec 2;6(12):e1001230. doi: 10.1371/journal.pgen.1001230.
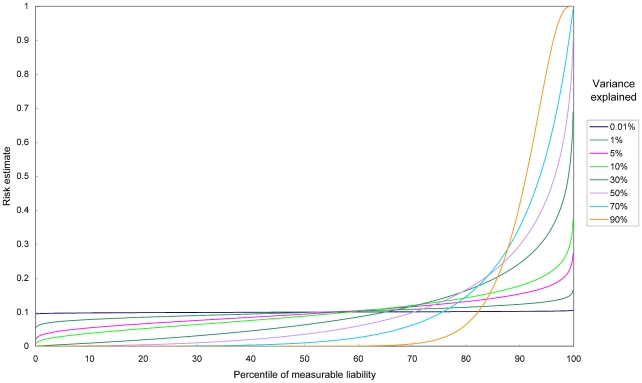
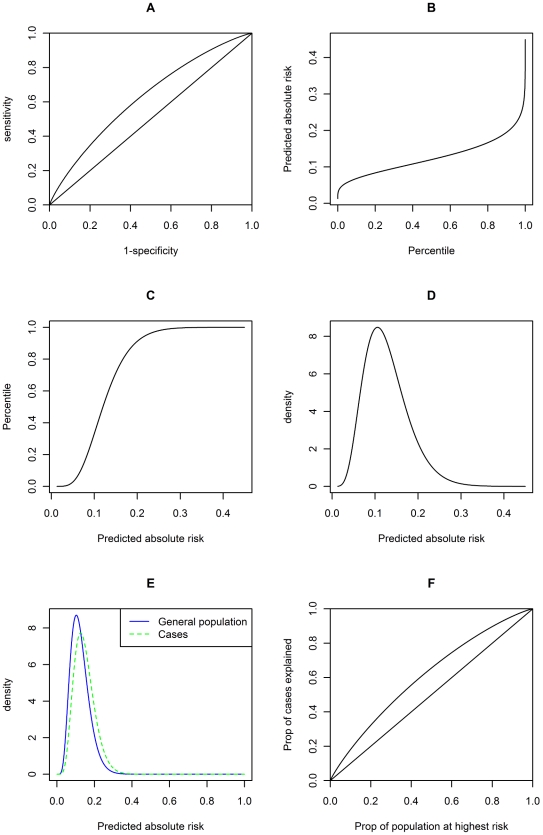
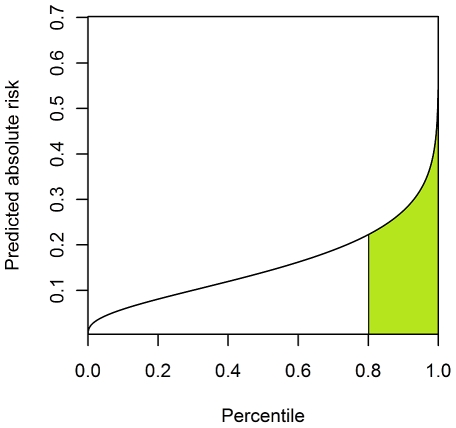
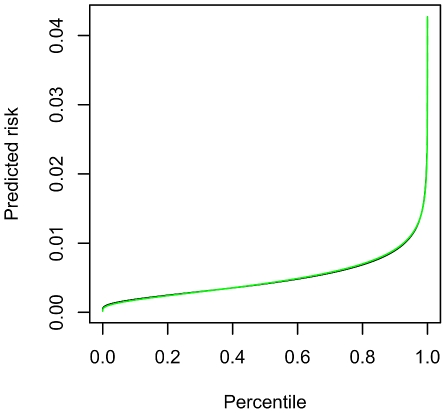
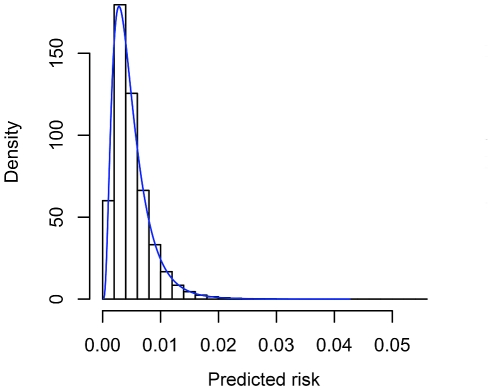
An increasing number of genetic variants have been identified for many complex diseases. However, it is controversial whether risk prediction based on genomic profiles will be useful clinically. Appropriate statistical measures to evaluate the performance of genetic risk prediction models are required. Previous studies have mainly focused on the use of the area under the receiver operating characteristic (ROC) curve, or AUC, to judge the predictive value of genetic tests. However, AUC has its limitations and should be complemented by other measures. In this study, we develop a novel unifying statistical framework that connects a large variety of predictive indices together. We showed that, given the overall disease probability and the level of variance in total liability (or heritability) explained by the genetic variants, we can estimate analytically a large variety of prediction metrics, for example the AUC, the mean risk difference between cases and non-cases, the net reclassification improvement (ability to reclassify people into high- and low-risk categories), the proportion of cases explained by a specific percentile of population at the highest risk, the variance of predicted risks, and the risk at any percentile. We also demonstrate how to construct graphs to visualize the performance of risk models, such as the ROC curve, the density of risks, and the predictiveness curve (disease risk plotted against risk percentile). The results from simulations match very well with our theoretical estimates. Finally we apply the methodology to nine complex diseases, evaluating the predictive power of genetic tests based on known susceptibility variants for each trait.
越来越多的遗传变异已被确定为许多复杂疾病的风险因素。然而,基于基因组图谱的风险预测在临床上是否有用还存在争议。需要适当的统计措施来评估遗传风险预测模型的性能。以前的研究主要集中在使用接收器操作特征 (ROC) 曲线下面积 (AUC) 来判断基因检测的预测价值。然而,AUC 有其局限性,应该用其他措施来补充。在这项研究中,我们开发了一种新的统一统计框架,将各种预测指标联系在一起。我们表明,给定总体疾病概率和遗传变异解释的总易感性(或遗传性)的方差水平,我们可以通过分析来估计各种预测指标,例如 AUC、病例与非病例之间的平均风险差异、净重新分类改善(将人们重新分类为高风险和低风险类别的能力)、特定百分比的人群在最高风险中的解释比例、预测风险的方差和任何百分位数的风险。我们还演示了如何构建图形来可视化风险模型的性能,例如 ROC 曲线、风险密度和预测性曲线(疾病风险与风险百分位数的关系)。模拟结果与我们的理论估计非常吻合。最后,我们将该方法应用于九种复杂疾病,评估基于每个特征的已知易感性变异的基因检测的预测能力。