Institute for Informatics, Ludwig-Maximilians-Universität Münchchen, Amalienstrasse 17, 80333 München, Germany.
Bioinformatics. 2011 Jul 1;27(13):i366-73. doi: 10.1093/bioinformatics/btr228.
Current gene set enrichment approaches do not take interactions and associations between set members into account. Mutual activation and inhibition causing positive and negative correlation among set members are thus neglected. As a consequence, inconsistent regulations and contextless expression changes are reported and, thus, the biological interpretation of the result is impeded.
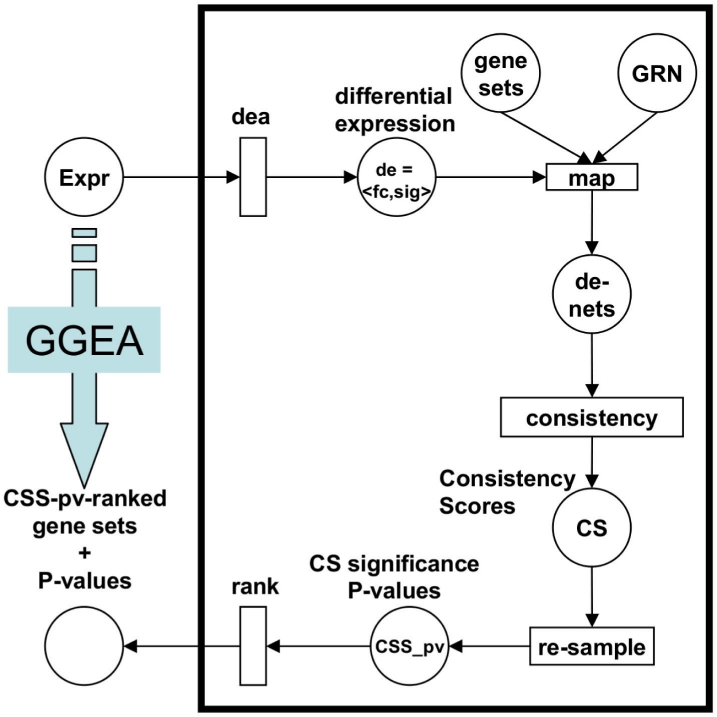
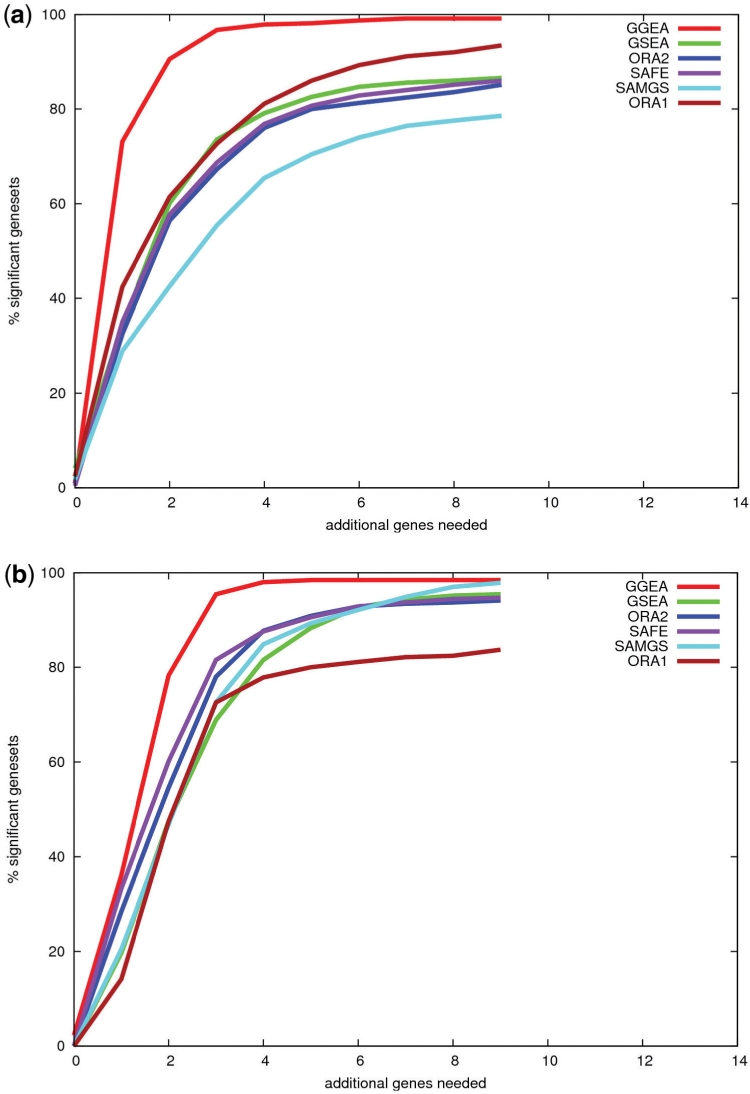
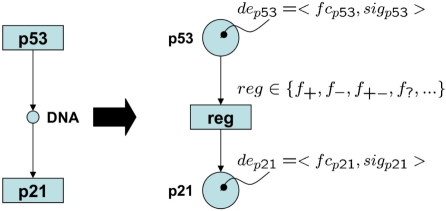
We analyzed established gene set enrichment methods and their result sets in a large-scale investigation of 1000 expression datasets. The reported statistically significant gene sets exhibit only average consistency between the observed patterns of differential expression and known regulatory interactions. We present Gene Graph Enrichment Analysis (GGEA) to detect consistently and coherently enriched gene sets, based on prior knowledge derived from directed gene regulatory networks. Firstly, GGEA improves the concordance of pairwise regulation with individual expression changes in respective pairs of regulating and regulated genes, compared with set enrichment methods. Secondly, GGEA yields result sets where a large fraction of relevant expression changes can be explained by nearby regulators, such as transcription factors, again improving on set-based methods. Thirdly, we demonstrate in additional case studies that GGEA can be applied to human regulatory pathways, where it sensitively detects very specific regulation processes, which are altered in tumors of the central nervous system. GGEA significantly increases the detection of gene sets where measured positively or negatively correlated expression patterns coincide with directed inducing or repressing relationships, thus facilitating further interpretation of gene expression data.
The method and accompanying visualization capabilities have been bundled into an R package and tied to a grahical user interface, the Galaxy workflow environment, that is running as a web server.
Ludwig.Geistlinger@bio.ifi.lmu.de; Ralf.Zimmer@bio.ifi.lmu.de.
当前的基因集富集方法没有考虑到集合成员之间的相互作用和关联。因此,忽略了集合成员之间的相互激活和抑制所导致的正相关和负相关。结果是,报告了不一致的调节和上下文无关的表达变化,从而阻碍了结果的生物学解释。
我们在对 1000 个表达数据集的大规模调查中分析了已建立的基因集富集方法及其结果集。报告的具有统计学意义的基因集仅在观察到的差异表达模式与已知的调节相互作用之间表现出平均一致性。我们提出了基于有向基因调控网络的先验知识来检测一致且一致富集的基因集的基因图富集分析(GGEA)。首先,与基于集合的方法相比,GGEA 提高了对各自调控和受调控基因对中个体表达变化的成对调节的一致性。其次,GGEA 产生的结果集可以通过附近的调节剂(例如转录因子)来解释大量相关的表达变化,从而进一步改进了基于集合的方法。第三,我们在另外的案例研究中证明,GGEA 可应用于人类调控途径,其中它敏感地检测到中枢神经系统肿瘤中改变的非常特定的调节过程。GGEA 大大增加了检测基因集的能力,其中测量的正相关或负相关表达模式与有向诱导或抑制关系一致,从而有助于进一步解释基因表达数据。
该方法及其伴随的可视化功能已被捆绑到一个 R 包中,并与图形用户界面(Galaxy 工作流程环境)绑定,该环境作为 Web 服务器运行。
Ludwig.Geistlinger@bio.ifi.lmu.de;Ralf.Zimmer@bio.ifi.lmu.de。