Department of Epidemiology, University of Texas MD Anderson Cancer Center, Houston, Texas, USA.
Genet Epidemiol. 2012 Jan;36(1):17-21. doi: 10.1002/gepi.20640. Epub 2011 Dec 6.
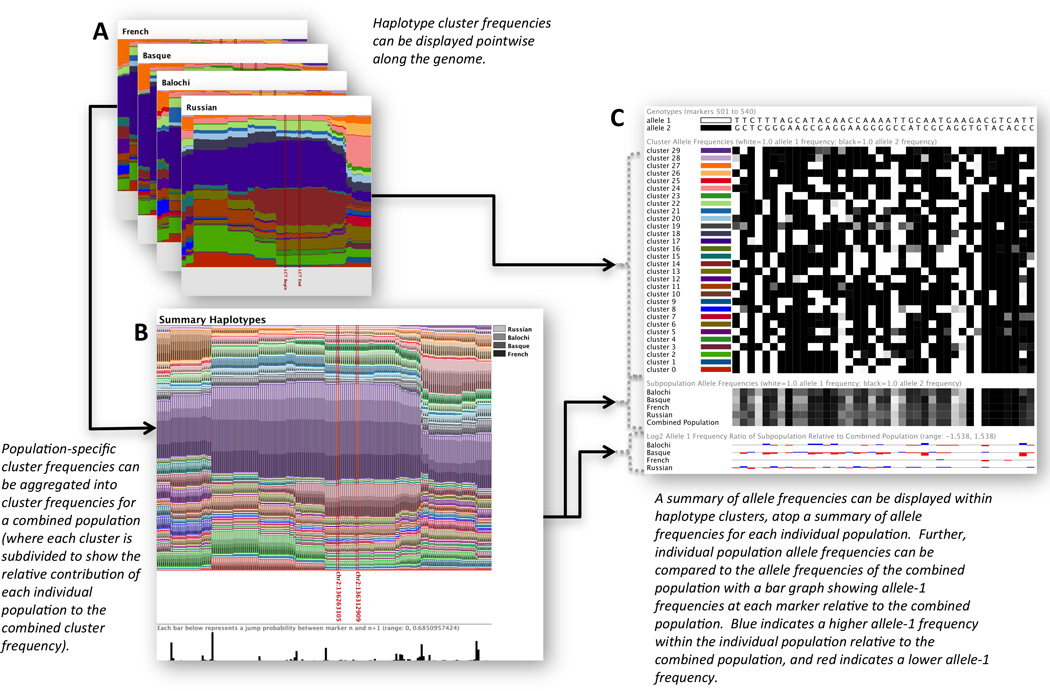
Patterns of linkage disequilibrium are often depicted pictorially by using tools that rely on visualizations of raw data or pairwise correlations among individual markers. Such approaches can fail to highlight some of the more interesting and complex features of haplotype structure. To enable natural visual comparisons of haplotype structure across subgroups of a population (e.g. isolated subpopulations or cases and controls), we propose an alternative visualization that provides a novel graphical representation of haplotype frequencies. We introduce Haploscope, a tool for visualizing the haplotype cluster frequencies that are produced by statistical models for population haplotype variation. We demonstrate the utility of our technique by examining haplotypes around the LCT gene, an example of recent positive selection, in samples from the Human Genome Diversity Panel. Haploscope, which has flexible options for annotation and inspection of haplotypes, is available for download at http://scheet.org/software.
连锁不平衡模式通常通过使用依赖于原始数据可视化或个体标记之间两两相关性的工具来进行图形描绘。这些方法可能无法突出显示单倍型结构的一些更有趣和复杂的特征。为了能够在人群的亚组(例如,隔离的亚群或病例和对照)之间对单倍型结构进行自然的视觉比较,我们提出了一种替代的可视化方法,该方法提供了单倍型频率的新颖图形表示。我们引入了 Haploscope,这是一种用于可视化群体单倍型变异的统计模型生成的单倍型簇频率的工具。我们通过检查人类基因组多样性面板样本中 LCT 基因周围的单倍型来展示我们技术的实用性,这是一个最近正选择的例子。Haploscope 具有灵活的注释和检查单倍型的选项,可在 http://scheet.org/software 上下载。