• 文献检索
  • 文档翻译
  • 深度研究
  • 学术资讯
  • Suppr Zotero 插件Zotero 插件
  • 邀请有礼
  • 套餐&价格
  • 历史记录
应用&插件
Suppr Zotero 插件Zotero 插件浏览器插件Mac 客户端Windows 客户端微信小程序
定价
高级版会员购买积分包购买API积分包
服务
文献检索文档翻译深度研究API 文档MCP 服务
关于我们
关于 Suppr公司介绍联系我们用户协议隐私条款
关注我们

Suppr 超能文献

核心技术专利:CN118964589B侵权必究
粤ICP备2023148730 号-1Suppr @ 2026

文献检索

告别复杂PubMed语法,用中文像聊天一样搜索,搜遍4000万医学文献。AI智能推荐,让科研检索更轻松。

立即免费搜索

文件翻译

保留排版,准确专业,支持PDF/Word/PPT等文件格式,支持 12+语言互译。

免费翻译文档

深度研究

AI帮你快速写综述,25分钟生成高质量综述,智能提取关键信息,辅助科研写作。

立即免费体验

用于间接估计的灵活二维死亡率模型。

A flexible two-dimensional mortality model for use in indirect estimation.

机构信息

University of California, Berkeley, USA.

出版信息

Popul Stud (Camb). 2012 Mar;66(1):1-28. doi: 10.1080/00324728.2011.611411. Epub 2011 Dec 13.

DOI:10.1080/00324728.2011.611411
PMID:22150635
原文链接:https://pmc.ncbi.nlm.nih.gov/articles/PMC4046865/
Abstract

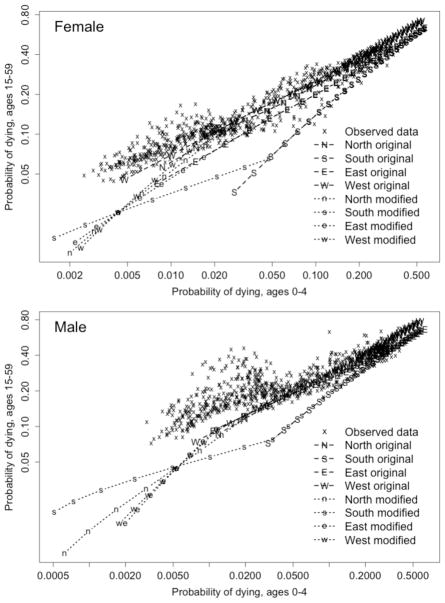
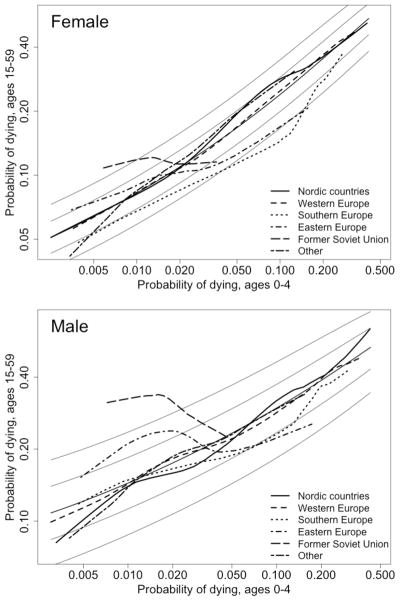
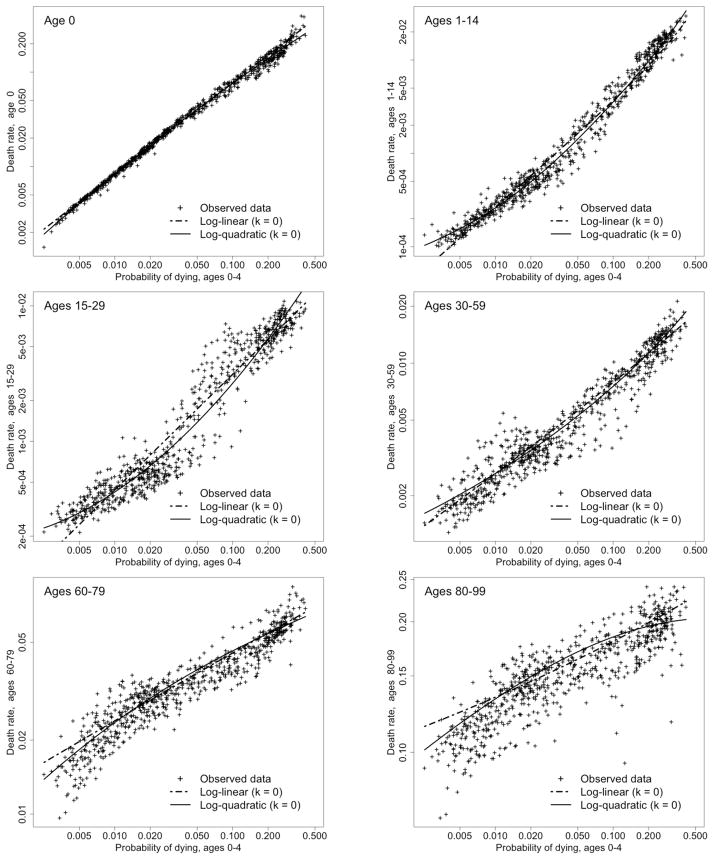
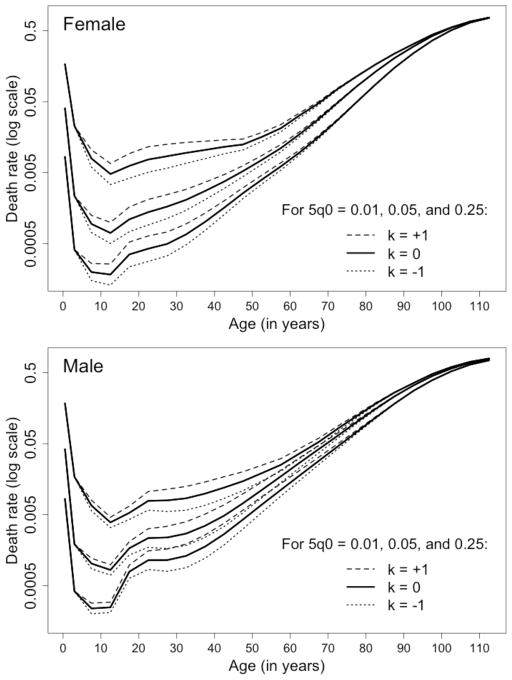
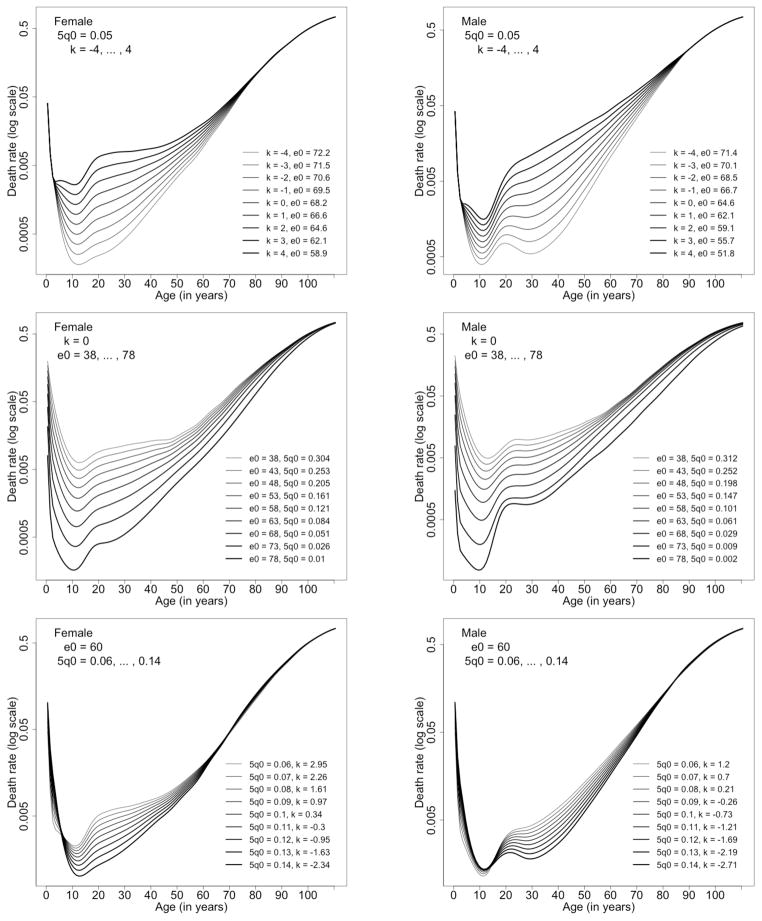
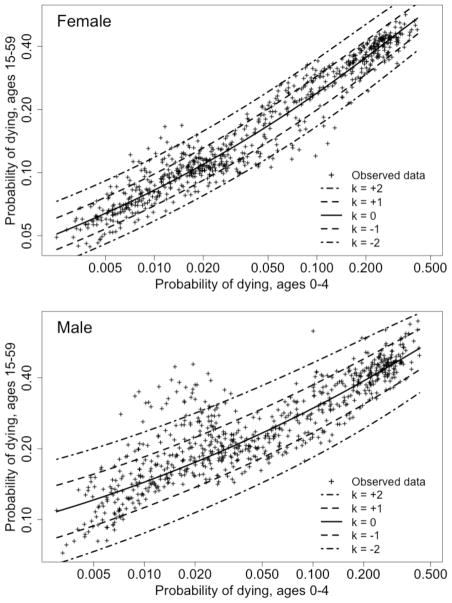
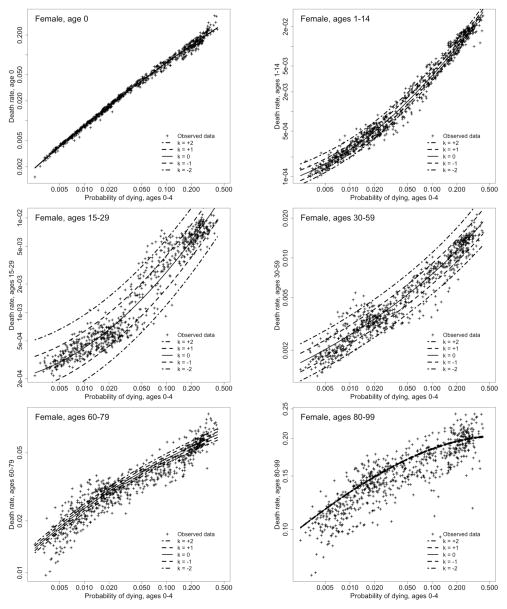
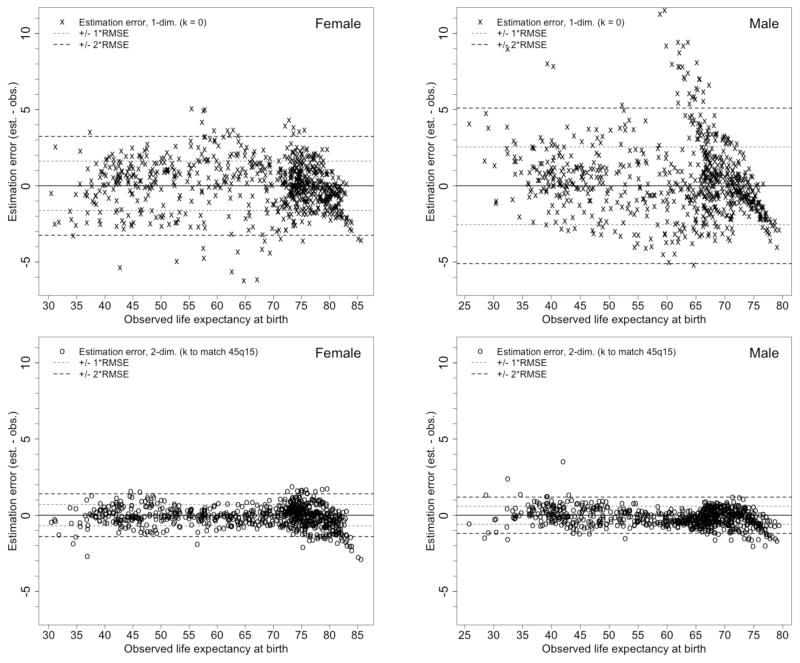
Mortality estimates for many populations are derived using model life tables, which describe typical age patterns of human mortality. We propose a new system of model life tables as a means of improving the quality and transparency of such estimates. A flexible two-dimensional model was fitted to a collection of life tables from the Human Mortality Database. The model can be used to estimate full life tables given one or two pieces of information: child mortality only, or child and adult mortality. Using life tables from a variety of sources, we have compared the performance of new and old methods. The new model outperforms the Coale-Demeny and UN model life tables. Estimation errors are similar to those produced by the modified Brass logit procedure. The proposed model is better suited to the practical needs of mortality estimation, since both input parameters are continuous yet the second one is optional.

摘要

许多人群的死亡率估计是使用模型生命表得出的,这些生命表描述了人类死亡率的典型年龄模式。我们提出了一种新的模型生命表系统,作为提高这些估计质量和透明度的一种手段。我们将一个灵活的二维模型拟合到人类死亡率数据库中的一组生命表中。该模型可以用于根据一条或两条信息来估计完整的生命表:仅儿童死亡率,或儿童和成人死亡率。使用来自各种来源的生命表,我们比较了新旧方法的性能。新模型优于考尔-德梅尼和联合国生命表。估计误差与经过修正的 Brass 对数概率模型产生的误差相似。所提出的模型更适合死亡率估计的实际需要,因为两个输入参数都是连续的,但第二个是可选的。

https://cdn.ncbi.nlm.nih.gov/pmc/blobs/81d0/4046865/353b92ae4092/nihms579756f10.jpg
https://cdn.ncbi.nlm.nih.gov/pmc/blobs/81d0/4046865/102889dbf819/nihms579756f1.jpg
https://cdn.ncbi.nlm.nih.gov/pmc/blobs/81d0/4046865/b522da2a5cb9/nihms579756f2.jpg
https://cdn.ncbi.nlm.nih.gov/pmc/blobs/81d0/4046865/9448b6a693b4/nihms579756f3.jpg
https://cdn.ncbi.nlm.nih.gov/pmc/blobs/81d0/4046865/4336e088edf8/nihms579756f4.jpg
https://cdn.ncbi.nlm.nih.gov/pmc/blobs/81d0/4046865/ecc427721b4c/nihms579756f5.jpg
https://cdn.ncbi.nlm.nih.gov/pmc/blobs/81d0/4046865/d3629e27d288/nihms579756f6a.jpg
https://cdn.ncbi.nlm.nih.gov/pmc/blobs/81d0/4046865/471cd13d5372/nihms579756f7.jpg
https://cdn.ncbi.nlm.nih.gov/pmc/blobs/81d0/4046865/73b3188b64ef/nihms579756f8.jpg
https://cdn.ncbi.nlm.nih.gov/pmc/blobs/81d0/4046865/cf0b77477932/nihms579756f9.jpg
https://cdn.ncbi.nlm.nih.gov/pmc/blobs/81d0/4046865/353b92ae4092/nihms579756f10.jpg

相似文献

1
A flexible two-dimensional mortality model for use in indirect estimation.用于间接估计的灵活二维死亡率模型。
Popul Stud (Camb). 2012 Mar;66(1):1-28. doi: 10.1080/00324728.2011.611411. Epub 2011 Dec 13.
2
A simple model for linking life tables by survival-mortality ratios.一种通过生存-死亡率比连接生命表的简单模型。
Demography. 1983 May;20(2):227-34.
3
Multivariable flexible modelling for estimating complete, smoothed life tables for sub-national populations.用于估计次国家级人群完整、平滑生命表的多变量灵活建模。
BMC Public Health. 2015 Dec 16;15:1240. doi: 10.1186/s12889-015-2534-3.
4
Estimation of death rates in US states with small subpopulations.美国人口较少的州的死亡率估计。
Stat Med. 2015 May 20;34(11):1940-52. doi: 10.1002/sim.6385. Epub 2014 Dec 10.
5
Global age-sex-specific mortality, life expectancy, and population estimates in 204 countries and territories and 811 subnational locations, 1950-2021, and the impact of the COVID-19 pandemic: a comprehensive demographic analysis for the Global Burden of Disease Study 2021.204 个国家和地区及 811 个次国家级行政单位 1950 年至 2021 年的全球年龄、性别特异性死亡率、预期寿命和人口估计,以及 COVID-19 大流行的影响:2021 年全球疾病负担研究的综合人口分析。
Lancet. 2024 May 18;403(10440):1989-2056. doi: 10.1016/S0140-6736(24)00476-8. Epub 2024 Mar 11.
6
Global, regional, and national age-sex-specific mortality and life expectancy, 1950-2017: a systematic analysis for the Global Burden of Disease Study 2017.全球、区域和国家按年龄、性别划分的死亡率和预期寿命,1950-2017 年:2017 年全球疾病负担研究的系统分析。
Lancet. 2018 Nov 10;392(10159):1684-1735. doi: 10.1016/S0140-6736(18)31891-9. Epub 2018 Nov 8.
7
United States life tables, 2008.《2008年美国生命表》
Natl Vital Stat Rep. 2012 Sep 24;61(3):1-63.
8
U.S. decennial life tables for 1999-2001: state life tables.1999 - 2001年美国十年期生命表:各州生命表。
Natl Vital Stat Rep. 2012 Sep 14;60(9):1-66.
9
United States life tables, 2007.《2007年美国生命表》
Natl Vital Stat Rep. 2011 Sep 28;59(9):1-60.
10
U.S. State Life Tables, 2018.美国 2018 年各州生命表
Natl Vital Stat Rep. 2021 Mar;70(1):1-18.

引用本文的文献

1
Associations between national plant-based vs animal-based protein supplies and age-specific mortality in human populations.国家植物性与动物性蛋白质供应与人群特定年龄死亡率之间的关联。
Nat Commun. 2025 Apr 11;16(1):3431. doi: 10.1038/s41467-025-58475-1.
2
Adapting the log quadratic model to estimate age- and cause-specific mortality among neonates.将对数二次模型改编用于估计新生儿的年龄别和死因别死亡率。
PLoS One. 2024 Jul 12;19(7):e0304841. doi: 10.1371/journal.pone.0304841. eCollection 2024.
3
Life expectancy, long-term care demand and dynamic financing mechanism simulation: an empirical study of Zhejiang Pilot, China.

本文引用的文献

1
Revised regional model life tables at very low levels of mortality.极低死亡率下的修订区域模型生命表。
Popul Index. 1989 Winter;55(4):613-43.
预期寿命、长期护理需求与动态筹资机制模拟:中国浙江试点的实证研究。
BMC Health Serv Res. 2024 Apr 15;24(1):469. doi: 10.1186/s12913-024-10875-7.
4
Global age-sex-specific mortality, life expectancy, and population estimates in 204 countries and territories and 811 subnational locations, 1950-2021, and the impact of the COVID-19 pandemic: a comprehensive demographic analysis for the Global Burden of Disease Study 2021.204 个国家和地区及 811 个次国家级行政单位 1950 年至 2021 年的全球年龄、性别特异性死亡率、预期寿命和人口估计,以及 COVID-19 大流行的影响:2021 年全球疾病负担研究的综合人口分析。
Lancet. 2024 May 18;403(10440):1989-2056. doi: 10.1016/S0140-6736(24)00476-8. Epub 2024 Mar 11.
5
Climate migration amplifies demographic change and population aging.气候移民加剧了人口结构变化和人口老龄化。
Proc Natl Acad Sci U S A. 2024 Jan 16;121(3):e2206192119. doi: 10.1073/pnas.2206192119. Epub 2024 Jan 8.
6
Life expectancy inequalities between regions of China 2004-2020: contribution of age- and cause-specific mortality.中国地区间预期寿命的不平等:2004-2020 年年龄和死因特异性死亡率的贡献。
Front Public Health. 2023 Dec 18;11:1271469. doi: 10.3389/fpubh.2023.1271469. eCollection 2023.
7
Age patterns of under-5 mortality in sub-Saharan Africa during 1990-2018: A comparison of estimates from demographic surveillance with full birth histories and the historic record.1990 - 2018年撒哈拉以南非洲地区5岁以下儿童死亡率的年龄模式:基于人口监测估计值与完整出生史及历史记录的比较
Demogr Res. 2021 Jan-Jun;44:415-442. doi: 10.4054/demres.2021.44.18. Epub 2021 Mar 5.
8
Urban-rural lifespan disparities and cause-deleted analysis: evidence from China.城乡寿命差距与死因删失分析:来自中国的证据。
BMJ Open. 2022 Feb 15;12(2):e050707. doi: 10.1136/bmjopen-2021-050707.
9
Modeling Age Patterns of Under-5 Mortality: Results From a Log-Quadratic Model Applied to High-Quality Vital Registration Data.建模 5 岁以下儿童死亡率的年龄模式:应用于高质量生命登记数据的对数二次模型的结果。
Demography. 2022 Feb 1;59(1):321-347. doi: 10.1215/00703370-9709538.
10
Assessing mortality registration in Kerala: the MARANAM study.评估喀拉拉邦的死亡率登记情况:玛拉南姆研究
Genus. 2022;78(1):1. doi: 10.1186/s41118-021-00149-z. Epub 2022 Jan 10.